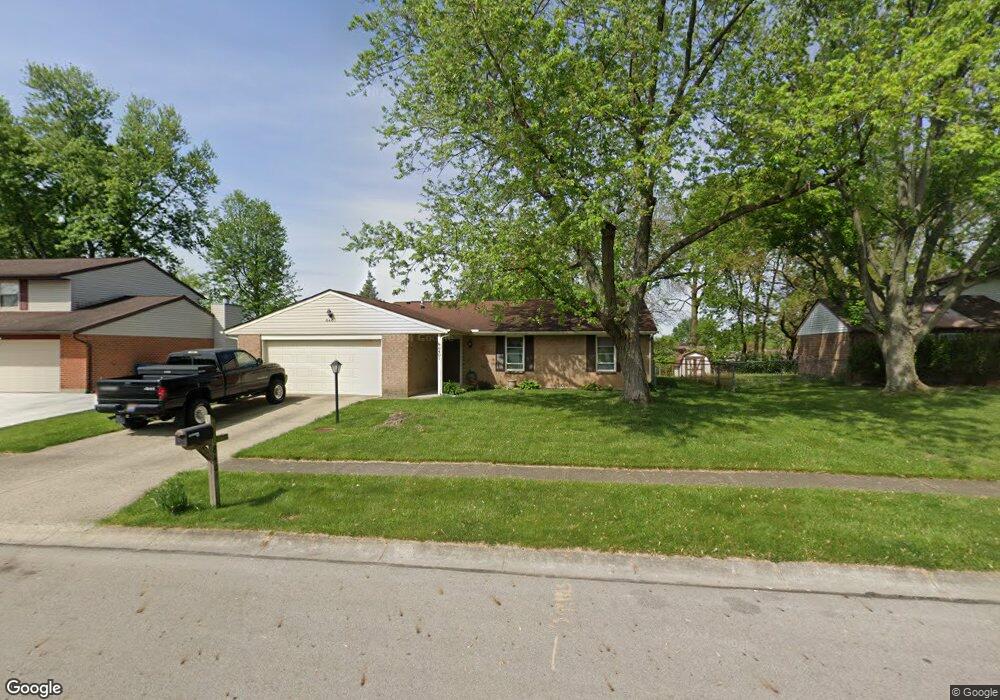
8401 Pinegate Way Dayton, OH 45424
Estimated Value: $223,051 - $246,000
3
Beds
2
Baths
1,256
Sq Ft
$186/Sq Ft
Est. Value
About This Home
This home is located at 8401 Pinegate Way, Dayton, OH 45424 and is currently estimated at $233,763, approximately $186 per square foot. 8401 Pinegate Way is a home located in Montgomery County with nearby schools including Wayne High School and Huber Heights Christian Academy.
Ownership History
Date
Name
Owned For
Owner Type
Purchase Details
Closed on
Jul 3, 2003
Sold by
Eastman Matthew B and Mauch Catherine S
Bought by
Eastman Matthew B and Eastman Catherine S
Current Estimated Value
Home Financials for this Owner
Home Financials are based on the most recent Mortgage that was taken out on this home.
Original Mortgage
$102,600
Interest Rate
5.37%
Mortgage Type
Purchase Money Mortgage
Purchase Details
Closed on
Mar 7, 2001
Sold by
Eastman Matthew B
Bought by
Eastman Matthew B and Mauch Catherine S
Home Financials for this Owner
Home Financials are based on the most recent Mortgage that was taken out on this home.
Original Mortgage
$102,600
Interest Rate
7.13%
Purchase Details
Closed on
Mar 30, 2000
Sold by
Stewart John W and Stewart Kathleen D
Bought by
Eastman Matthew B
Home Financials for this Owner
Home Financials are based on the most recent Mortgage that was taken out on this home.
Original Mortgage
$101,900
Interest Rate
9.25%
Create a Home Valuation Report for This Property
The Home Valuation Report is an in-depth analysis detailing your home's value as well as a comparison with similar homes in the area
Home Values in the Area
Average Home Value in this Area
Purchase History
| Date | Buyer | Sale Price | Title Company |
|---|---|---|---|
| Eastman Matthew B | -- | -- | |
| Eastman Matthew B | -- | -- | |
| Eastman Matthew B | $101,900 | -- |
Source: Public Records
Mortgage History
| Date | Status | Borrower | Loan Amount |
|---|---|---|---|
| Closed | Eastman Matthew B | $102,600 | |
| Closed | Eastman Matthew B | $102,600 | |
| Closed | Eastman Matthew B | $101,900 |
Source: Public Records
Tax History Compared to Growth
Tax History
| Year | Tax Paid | Tax Assessment Tax Assessment Total Assessment is a certain percentage of the fair market value that is determined by local assessors to be the total taxable value of land and additions on the property. | Land | Improvement |
|---|---|---|---|---|
| 2024 | $2,868 | $56,200 | $14,910 | $41,290 |
| 2023 | $2,868 | $56,200 | $14,910 | $41,290 |
| 2022 | $2,587 | $39,570 | $10,500 | $29,070 |
| 2021 | $2,595 | $39,570 | $10,500 | $29,070 |
| 2020 | $2,598 | $39,570 | $10,500 | $29,070 |
| 2019 | $2,598 | $35,010 | $10,500 | $24,510 |
| 2018 | $2,607 | $35,010 | $10,500 | $24,510 |
| 2017 | $2,589 | $35,010 | $10,500 | $24,510 |
| 2016 | $2,585 | $34,090 | $10,500 | $23,590 |
| 2015 | $2,552 | $34,090 | $10,500 | $23,590 |
| 2014 | $2,552 | $34,090 | $10,500 | $23,590 |
| 2012 | -- | $38,370 | $10,500 | $27,870 |
Source: Public Records
Map
Nearby Homes
- 5901 Timbergate Trail
- 8948 Autumngate Ln
- 5660 Shull Rd
- 8671 Pinegate Way
- 6117 Charlesgate Rd
- 8436 Indian Mound Dr
- 8554 Schoolgate Dr
- 4957 Country Park Dr
- 8041 Bushclover Dr
- 6089 Green Knolls Dr
- 8133 Bushclover Dr
- 6219 Beacon Tree Ct
- 8830 Christygate Ln
- 4704 Cobblestone Dr Unit 4704
- 4676 Cobblestone Dr Unit 4676
- 3109 Coneflower Dr
- 6334 Shull Rd
- 4620 Cobblestone Dr Unit 4620
- 8930 Century Ln
- 4010 Redbud Way
- 8391 Pinegate Way
- 8411 Pinegate Way
- 5853 Stonegate Ct
- 8381 Pinegate Way
- 8421 Pinegate Way
- 5863 Stonegate Ct
- 8410 Pinegate Way
- 8371 Pinegate Way
- 8431 Pinegate Way
- 5843 Stonegate Ct
- 8420 Pinegate Way
- 8914 Autumngate Ln
- 8916 Autumngate Ln
- 8912 Autumngate Ln
- 5862 Stonegate Ct
- 5900 Timbergate Trail
- 8430 Pinegate Way
- 8361 Pinegate Way
- 8441 Pinegate Way
- 5833 Stonegate Ct