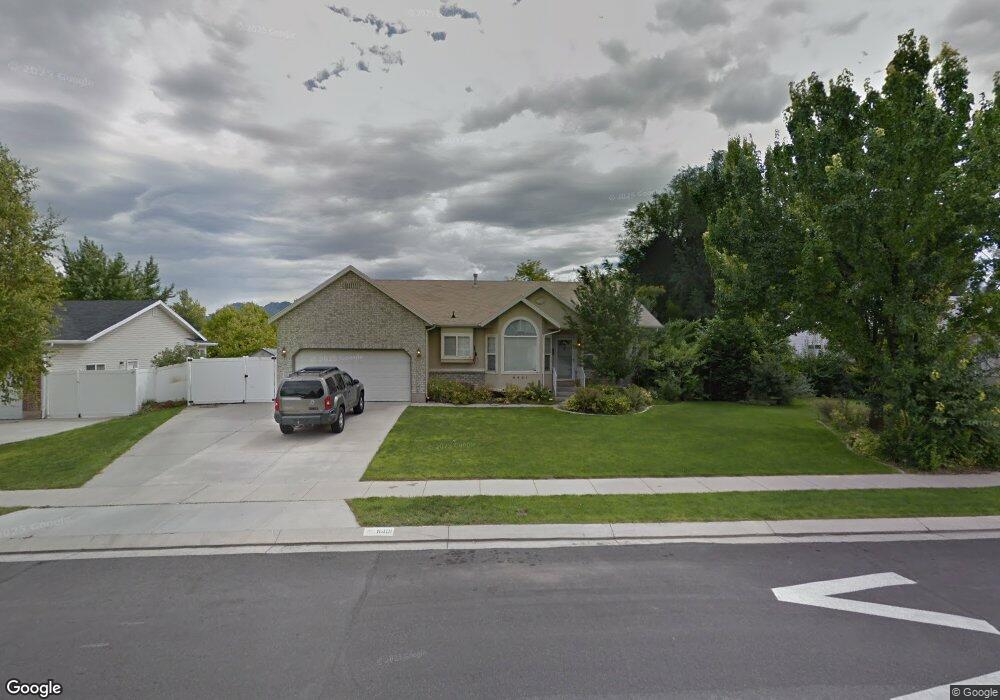
8401 S 1950 W West Jordan, UT 84088
Estimated Value: $577,000 - $601,000
4
Beds
3
Baths
1,344
Sq Ft
$438/Sq Ft
Est. Value
About This Home
This home is located at 8401 S 1950 W, West Jordan, UT 84088 and is currently estimated at $588,670, approximately $437 per square foot. 8401 S 1950 W is a home located in Salt Lake County with nearby schools including Westvale Elementary School, West Jordan Middle School, and West Jordan High School.
Ownership History
Date
Name
Owned For
Owner Type
Purchase Details
Closed on
Nov 15, 2016
Sold by
Pincock Shari
Bought by
Pincock Shari
Current Estimated Value
Purchase Details
Closed on
Apr 29, 2005
Sold by
Pincock Shari
Bought by
Pincock Shari and Pincock Family Trust
Purchase Details
Closed on
Apr 30, 1998
Sold by
Perry Homes Inc
Bought by
Pincock Shari
Home Financials for this Owner
Home Financials are based on the most recent Mortgage that was taken out on this home.
Original Mortgage
$123,000
Outstanding Balance
$23,950
Interest Rate
7.06%
Estimated Equity
$564,720
Create a Home Valuation Report for This Property
The Home Valuation Report is an in-depth analysis detailing your home's value as well as a comparison with similar homes in the area
Home Values in the Area
Average Home Value in this Area
Purchase History
| Date | Buyer | Sale Price | Title Company |
|---|---|---|---|
| Pincock Shari | -- | First American Title | |
| Pincock Shari | -- | -- | |
| Pincock Shari | -- | -- |
Source: Public Records
Mortgage History
| Date | Status | Borrower | Loan Amount |
|---|---|---|---|
| Open | Pincock Shari | $123,000 |
Source: Public Records
Tax History Compared to Growth
Tax History
| Year | Tax Paid | Tax Assessment Tax Assessment Total Assessment is a certain percentage of the fair market value that is determined by local assessors to be the total taxable value of land and additions on the property. | Land | Improvement |
|---|---|---|---|---|
| 2025 | $2,757 | $575,000 | $191,900 | $383,100 |
| 2024 | $2,757 | $530,500 | $177,000 | $353,500 |
| 2023 | $2,791 | $506,100 | $167,000 | $339,100 |
| 2022 | $2,887 | $515,100 | $163,700 | $351,400 |
| 2021 | $2,430 | $394,700 | $132,000 | $262,700 |
| 2020 | $2,294 | $349,600 | $132,000 | $217,600 |
| 2019 | $2,323 | $347,200 | $132,000 | $215,200 |
| 2018 | $2,186 | $324,100 | $96,800 | $227,300 |
| 2017 | $2,051 | $302,700 | $96,800 | $205,900 |
| 2016 | $1,954 | $270,900 | $96,800 | $174,100 |
| 2015 | $1,962 | $265,200 | $101,400 | $163,800 |
| 2014 | $1,829 | $243,400 | $94,000 | $149,400 |
Source: Public Records
Map
Nearby Homes
- 8510 S Redwood Rd
- 8518 S Redwood Rd
- 8383 S 2200 W
- 1689 W 8295 S Unit 2
- 8534 S Redwood Rd
- 1636 Plum Creek Dr
- 1790 W Sugar Factory Rd
- 14 San Miguel St
- 8140 S 2245 W
- 77 Rio Bravo Place
- 48 San Rafael Ct
- 8461 S 2385 W
- 8155 S Redwood Rd Unit 88
- 8155 S Redwood Rd Unit 142B
- 8155 S Redwood Rd Unit 95
- 8155 S Redwood Rd Unit 28
- 1773 W 8760 S
- 1633 W Rockaway Ln
- 2041 W 8820 S
- 1434 Autumn Oak Cir