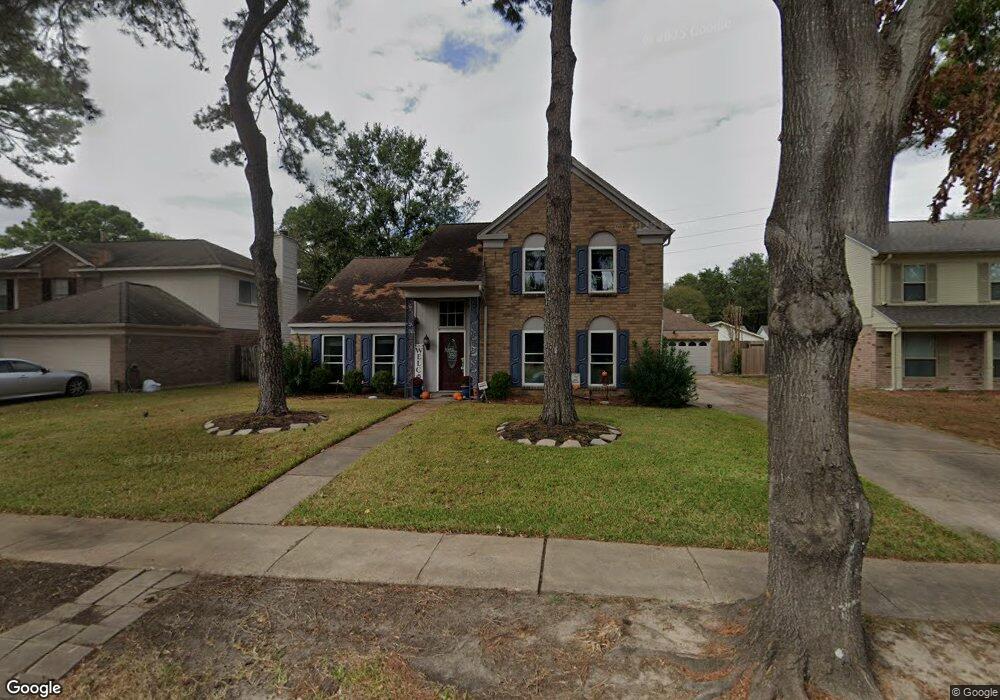
8403 Sunny Ridge Dr Houston, TX 77095
Copperfield NeighborhoodEstimated Value: $279,000 - $313,000
4
Beds
3
Baths
2,272
Sq Ft
$131/Sq Ft
Est. Value
About This Home
This home is located at 8403 Sunny Ridge Dr, Houston, TX 77095 and is currently estimated at $297,991, approximately $131 per square foot. 8403 Sunny Ridge Dr is a home located in Harris County with nearby schools including Fiest Elementary School, Labay Middle School, and Cypress Falls High School.
Ownership History
Date
Name
Owned For
Owner Type
Purchase Details
Closed on
Dec 29, 2020
Sold by
Washo Ryan T and Washo Stephanie E
Bought by
Washo Ryan T
Current Estimated Value
Home Financials for this Owner
Home Financials are based on the most recent Mortgage that was taken out on this home.
Original Mortgage
$151,432
Outstanding Balance
$135,366
Interest Rate
2.8%
Mortgage Type
New Conventional
Estimated Equity
$162,625
Purchase Details
Closed on
May 15, 2014
Sold by
Friedman Bruce and Friedman Jo Ellen
Bought by
Washo Ryan T and Washo Stephanie E
Home Financials for this Owner
Home Financials are based on the most recent Mortgage that was taken out on this home.
Original Mortgage
$162,011
Interest Rate
4.25%
Mortgage Type
FHA
Purchase Details
Closed on
Feb 17, 1999
Sold by
Eriksen Erik A and Eriksen Elisabeth L
Bought by
Krane Jo Ellen
Home Financials for this Owner
Home Financials are based on the most recent Mortgage that was taken out on this home.
Original Mortgage
$101,599
Interest Rate
6.83%
Create a Home Valuation Report for This Property
The Home Valuation Report is an in-depth analysis detailing your home's value as well as a comparison with similar homes in the area
Home Values in the Area
Average Home Value in this Area
Purchase History
| Date | Buyer | Sale Price | Title Company |
|---|---|---|---|
| Washo Ryan T | -- | Accommodation | |
| Washo Ryan T | -- | First American Title | |
| Krane Jo Ellen | -- | First American Title |
Source: Public Records
Mortgage History
| Date | Status | Borrower | Loan Amount |
|---|---|---|---|
| Open | Washo Ryan T | $151,432 | |
| Closed | Washo Ryan T | $162,011 | |
| Previous Owner | Krane Jo Ellen | $101,599 |
Source: Public Records
Tax History Compared to Growth
Tax History
| Year | Tax Paid | Tax Assessment Tax Assessment Total Assessment is a certain percentage of the fair market value that is determined by local assessors to be the total taxable value of land and additions on the property. | Land | Improvement |
|---|---|---|---|---|
| 2025 | $5,486 | $272,136 | $73,081 | $199,055 |
| 2024 | $5,486 | $268,927 | $65,314 | $203,613 |
| 2023 | $5,486 | $279,024 | $65,314 | $213,710 |
| 2022 | $5,808 | $263,575 | $50,133 | $213,442 |
| 2021 | $4,934 | $212,512 | $50,133 | $162,379 |
| 2020 | $4,865 | $203,987 | $41,660 | $162,327 |
| 2019 | $4,728 | $191,547 | $32,834 | $158,713 |
| 2018 | $2,574 | $178,771 | $32,834 | $145,937 |
| 2017 | $4,100 | $178,771 | $32,834 | $145,937 |
| 2016 | $4,100 | $178,771 | $32,834 | $145,937 |
| 2015 | $3,561 | $171,035 | $32,834 | $138,201 |
| 2014 | $3,561 | $148,179 | $27,538 | $120,641 |
Source: Public Records
Map
Nearby Homes
- 8526 Hot Springs Dr
- 8306 Lake Crystal Dr
- 15954 Oak Mountain Dr
- 15918 Pinyon Creek Dr
- 8526 Greenleaf Lake Dr
- 8550 Sparkling Springs Dr
- 8203 Green Devon Dr
- 8426 Laurel Trails Dr
- 15611 Meadow Village Dr
- 15735 Jamie Lee Dr
- 8818 Apple Mill Dr
- 15634 Haleys Landing Ln
- 8550 Waiting Spring Ln
- 8211 Riverglade Dr
- 16111 Aberdeen Forest Dr
- 15339 Glenwood Park Dr
- 16123 Aberdeen Forest Dr
- 15610 Tarpon Springs Ct
- 16026 Autumn Falls Ln
- 8814 Sherina Park Dr
- 8407 Sunny Ridge Dr
- 8311 Sunny Ridge Dr
- 8414 Lake Crystal Dr
- 8418 Lake Crystal Dr
- 8406 Lake Crystal Dr
- 8411 Sunny Ridge Dr
- 8307 Sunny Ridge Dr
- 8422 Lake Crystal Dr
- 15838 Maple Manor Dr
- 8402 Lake Crystal Dr
- 15839 Maple Manor Dr
- 8426 Lake Crystal Dr
- 8415 Sunny Ridge Dr
- 15834 Maple Manor Dr
- 8502 Plum Lake Dr
- 8362 Lake Crystal Dr
- 15835 Maple Manor Dr
- 8506 Plum Lake Dr
- 8415 Lake Crystal Dr
- 8418 Plum Lake Dr