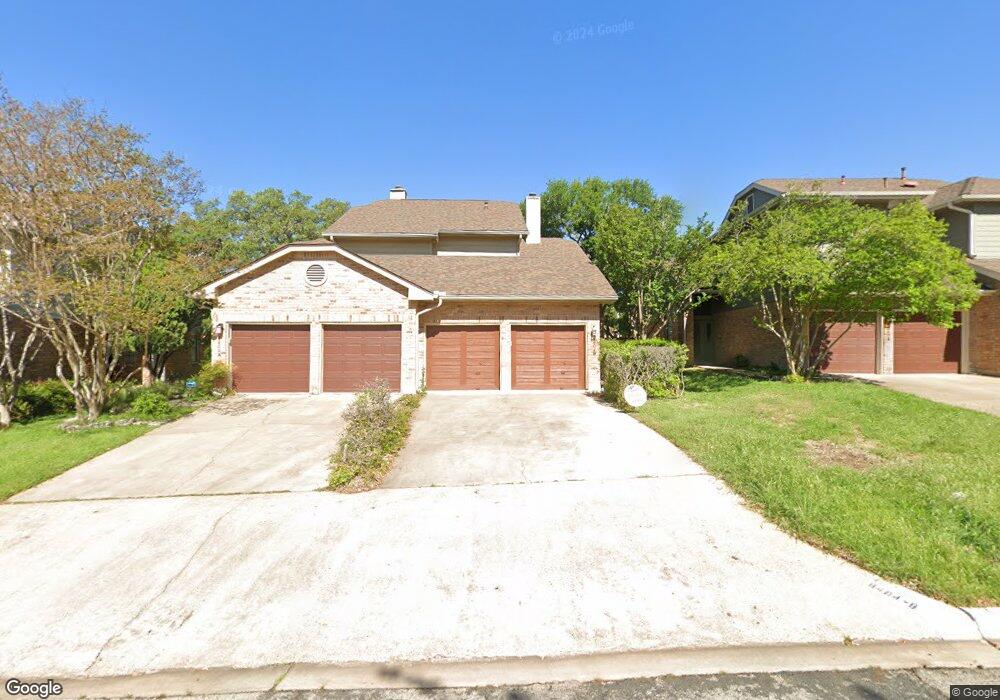
8404 Cima Oak Ln Unit C5 Austin, TX 78759
Westover Hills NeighborhoodEstimated Value: $366,000 - $478,000
--
Bed
--
Bath
1,248
Sq Ft
$331/Sq Ft
Est. Value
About This Home
This home is located at 8404 Cima Oak Ln Unit C5, Austin, TX 78759 and is currently estimated at $412,847, approximately $330 per square foot. 8404 Cima Oak Ln Unit C5 is a home located in Travis County with nearby schools including Hill Elementary School, Murchison Middle School, and Anderson High School.
Ownership History
Date
Name
Owned For
Owner Type
Purchase Details
Closed on
Dec 20, 2024
Sold by
Lott Gus K and Lott Mary C
Bought by
Spellings Britain
Current Estimated Value
Purchase Details
Closed on
Aug 16, 2007
Sold by
Seely Sue Ellen and York Chris M
Bought by
Lott Gus K and Lott Mary C
Home Financials for this Owner
Home Financials are based on the most recent Mortgage that was taken out on this home.
Original Mortgage
$202,500
Interest Rate
6.64%
Mortgage Type
Purchase Money Mortgage
Purchase Details
Closed on
Feb 26, 1997
Sold by
Russell Mary Janis and Russell Janis
Bought by
Sullivan Joseph A and Sullivan Julie E
Home Financials for this Owner
Home Financials are based on the most recent Mortgage that was taken out on this home.
Original Mortgage
$90,000
Interest Rate
7.89%
Create a Home Valuation Report for This Property
The Home Valuation Report is an in-depth analysis detailing your home's value as well as a comparison with similar homes in the area
Home Values in the Area
Average Home Value in this Area
Purchase History
| Date | Buyer | Sale Price | Title Company |
|---|---|---|---|
| Spellings Britain | -- | Independence Title | |
| Spellings Britain | -- | Independence Title | |
| Lott Gus K | -- | Multiple | |
| Sullivan Joseph A | -- | -- |
Source: Public Records
Mortgage History
| Date | Status | Borrower | Loan Amount |
|---|---|---|---|
| Previous Owner | Lott Gus K | $202,500 | |
| Previous Owner | Sullivan Joseph A | $90,000 |
Source: Public Records
Tax History Compared to Growth
Tax History
| Year | Tax Paid | Tax Assessment Tax Assessment Total Assessment is a certain percentage of the fair market value that is determined by local assessors to be the total taxable value of land and additions on the property. | Land | Improvement |
|---|---|---|---|---|
| 2025 | $9,674 | $355,759 | $17,624 | $338,135 |
| 2023 | $9,007 | $497,823 | $17,624 | $480,199 |
| 2022 | $8,441 | $427,396 | $17,624 | $409,772 |
| 2021 | $6,997 | $321,459 | $17,624 | $303,835 |
| 2020 | $5,817 | $271,189 | $105,746 | $165,443 |
| 2018 | $5,023 | $226,865 | $105,746 | $121,119 |
| 2017 | $5,332 | $239,094 | $105,746 | $133,348 |
| 2016 | $3,839 | $172,136 | $105,746 | $66,390 |
| 2015 | $4,098 | $172,203 | $105,746 | $66,457 |
| 2014 | $4,098 | $172,203 | $105,746 | $66,457 |
Source: Public Records
Map
Nearby Homes
- 8320 Greenslope Dr Unit B
- 8304 Bradford Edward Cove Unit B
- 3610 Branigan Ln
- 8121 Greenslope Dr
- 8801 Tallwood Dr Unit B
- 8314 Bent Tree Rd
- 3700 Steck Ave
- 8705 Silverhill Ln
- 8210 Bent Tree Rd Unit 138
- 8210 Bent Tree Rd Unit 226
- 8151 Meandering Way
- 8714 Ridgehill Dr
- 8888 Tallwood Dr Unit 1202
- 8888 Tallwood Dr Unit 2206
- 8888 Tallwood Dr Unit 3207
- 8888 Tallwood Dr Unit 2111
- 8900 Point Dr W
- 3615 Summit Bend
- 8102 Baywood Dr Unit A
- 8702 Wildridge Dr
- 8404 Cima Oak Ln
- 8404 Cima Oak Ln Unit B6
- 8500 Cima Oak Ln Unit B8
- 8500 Cima Oak Ln Unit A7
- 8402 Cima Oak Ln Unit A-3
- 8402 Cima Oak Ln Unit B4
- 8402 Cima Oak Ln Unit A3
- 8402 Cima Oak Ln Unit A
- 8402 Cima Oak Ln Unit B
- 8502 Cima Oak Ln Unit B10
- 8502 Cima Oak Ln Unit 9
- 8400 Cima Oak Ln Unit B2
- 8400 Cima Oak Ln Unit A1
- 8400 Cima Oak Ln Unit 1
- 8403 Cima Oak Ln Unit A36
- 8403 Cima Oak Ln Unit A
- 8501 Cima Oak Ln Unit A34
- 8501 Cima Oak Ln Unit B33
- 8504 Cima Oak Ln Unit B12
- 8504 Cima Oak Ln Unit A11