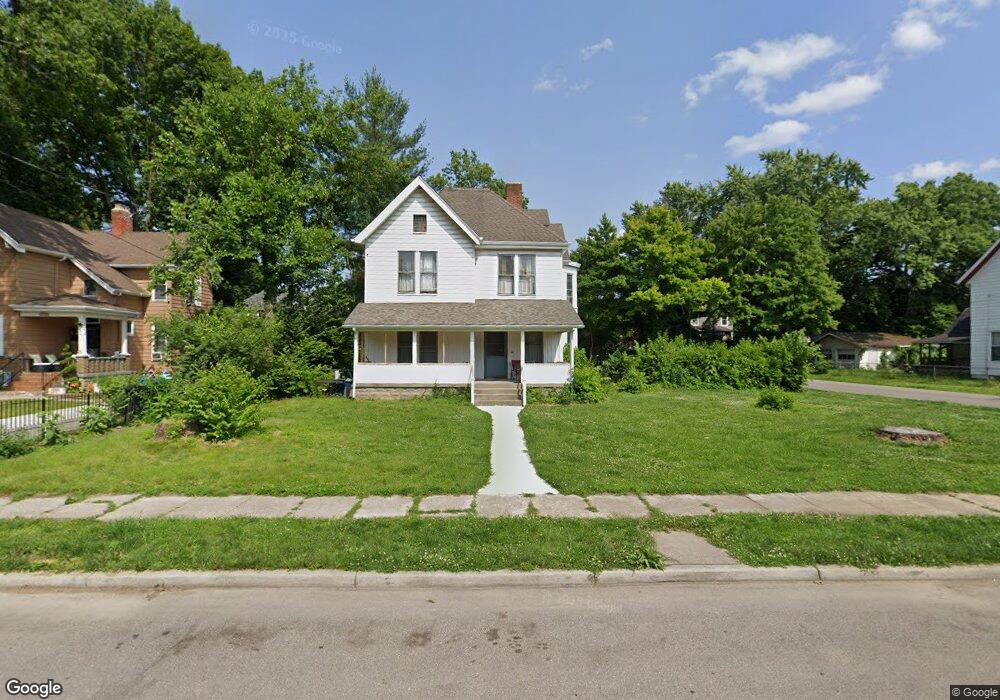
8404 Wiswell St Cincinnati, OH 45216
Hartwell NeighborhoodEstimated Value: $227,000 - $267,485
4
Beds
3
Baths
2,579
Sq Ft
$96/Sq Ft
Est. Value
About This Home
This home is located at 8404 Wiswell St, Cincinnati, OH 45216 and is currently estimated at $247,371, approximately $95 per square foot. 8404 Wiswell St is a home located in Hamilton County with nearby schools including Rising Stars at Carthage, Hartwell School, and Shroder High School.
Ownership History
Date
Name
Owned For
Owner Type
Purchase Details
Closed on
Jun 17, 2003
Sold by
Bolan Angela C and Bolan Michael
Bought by
Bolan Michael and Bolan Angela C
Current Estimated Value
Home Financials for this Owner
Home Financials are based on the most recent Mortgage that was taken out on this home.
Original Mortgage
$100,000
Outstanding Balance
$42,276
Interest Rate
5.3%
Mortgage Type
Unknown
Estimated Equity
$205,095
Purchase Details
Closed on
Mar 13, 2002
Sold by
Bolan Mary Virginia
Bought by
Bolan Angela C
Home Financials for this Owner
Home Financials are based on the most recent Mortgage that was taken out on this home.
Original Mortgage
$74,000
Interest Rate
6.93%
Mortgage Type
Balloon
Purchase Details
Closed on
Jun 4, 1997
Sold by
Bender Dorothy C
Bought by
Bolan Angela C and Bolan Daniel F
Purchase Details
Closed on
May 6, 1996
Sold by
Bender Thomas H and Bender Donna Marie
Bought by
Bender Dorothy C
Create a Home Valuation Report for This Property
The Home Valuation Report is an in-depth analysis detailing your home's value as well as a comparison with similar homes in the area
Home Values in the Area
Average Home Value in this Area
Purchase History
| Date | Buyer | Sale Price | Title Company |
|---|---|---|---|
| Bolan Michael | -- | -- | |
| Bolan Angela C | -- | Premier Title Services Inc | |
| Bolan Angela C | $70,000 | -- | |
| Bender Dorothy C | $33,000 | -- | |
| Bender Dorothy C | $33,000 | -- |
Source: Public Records
Mortgage History
| Date | Status | Borrower | Loan Amount |
|---|---|---|---|
| Open | Bolan Michael | $100,000 | |
| Closed | Bolan Angela C | $74,000 |
Source: Public Records
Tax History Compared to Growth
Tax History
| Year | Tax Paid | Tax Assessment Tax Assessment Total Assessment is a certain percentage of the fair market value that is determined by local assessors to be the total taxable value of land and additions on the property. | Land | Improvement |
|---|---|---|---|---|
| 2024 | $2,923 | $47,600 | $7,357 | $40,243 |
| 2023 | $2,985 | $47,600 | $7,357 | $40,243 |
| 2022 | $2,251 | $31,903 | $7,249 | $24,654 |
| 2021 | $2,148 | $31,903 | $7,249 | $24,654 |
| 2020 | $2,206 | $31,903 | $7,249 | $24,654 |
| 2019 | $2,233 | $29,540 | $6,713 | $22,827 |
| 2018 | $2,391 | $29,540 | $6,713 | $22,827 |
| 2017 | $2,124 | $29,540 | $6,713 | $22,827 |
| 2016 | $2,535 | $34,892 | $6,685 | $28,207 |
| 2015 | $2,289 | $34,892 | $6,685 | $28,207 |
| 2014 | $2,305 | $34,892 | $6,685 | $28,207 |
| 2013 | $2,462 | $36,726 | $7,035 | $29,691 |
Source: Public Records
Map
Nearby Homes
- 8421 Wiswell St
- 8410 Curzon Ave
- 8442 Anthony Wayne Ave
- 81 Hillsdale Ave
- 54 Hereford St
- 59 Ferndale Ave
- 223 Kearney St
- 504 Olden Ave
- 505 Olden Ave
- 177 Burns Ave
- 7901 Glenorchard Dr
- 29 Hartwell Ct
- 7866 Greenland Place
- 7871 Glenorchard Dr
- 410 Rolef Ave
- 20 Sherry Rd
- 214 Harriet St
- 715 Worthington Ave
- 645 Blanche Ave
- 1604 Crest Hill Ave
- 8410 Wiswell St
- 8414 Wiswell St
- 8384 Wiswell St
- 8416 Wiswell St
- 8380 Wiswell St
- 8377 Curzon Ave
- 8403 Curzon Ave
- 8401 Wiswell St
- 8409 Curzon Ave
- 8405 Wiswell St
- 8376 Wiswell St
- 8413 Curzon Ave
- 8411 Wiswell St
- 8424 Wiswell St
- 8373 Curzon Ave
- 8381 Wiswell St
- 8417 Curzon Ave
- 8372 Wiswell St
- 8365 Curzon Ave
- 8365 Curzon Ave