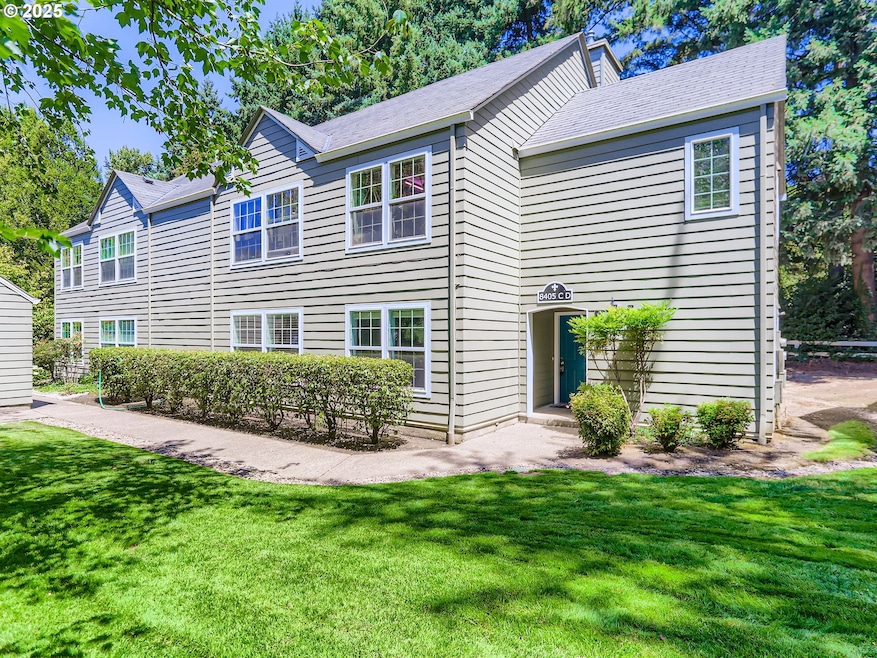
8405 SW Curry Dr Unit D Wilsonville, OR 97070
Estimated payment $2,883/month
Highlights
- View of Trees or Woods
- Community Pool
- Covered Patio or Porch
- Traditional Architecture
- Party Room
- 1 Car Detached Garage
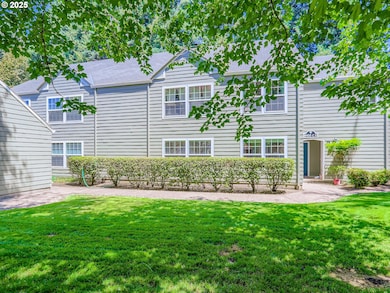
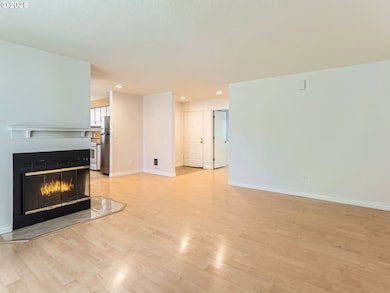
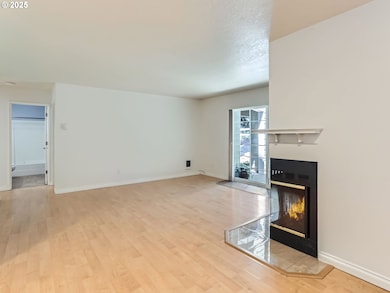
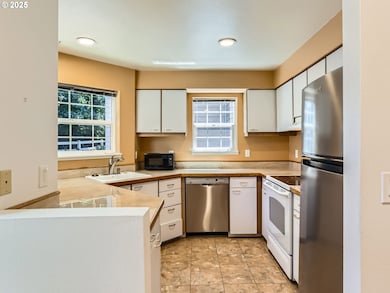
About This Home
Rare opportunity to own a 3-bedroom, main-level condo in the sought-after Charbonneau community of Wilsonville. This well-maintained home offers the ease of single-level living, complete with a private garage. Surrounded by beautifully landscaped grounds, residents enjoy access to golf, pools, walking trails, and more. A peaceful setting with a welcoming, active community—ideal for those looking to slow down without giving up convenience or connection.
Property Details
Home Type
- Condominium
Est. Annual Taxes
- $3,146
Year Built
- Built in 1987
HOA Fees
Parking
- 1 Car Detached Garage
- No Garage
- Garage Door Opener
- Driveway
- Off-Street Parking
Home Design
- Traditional Architecture
- Composition Roof
- Wood Siding
- Concrete Perimeter Foundation
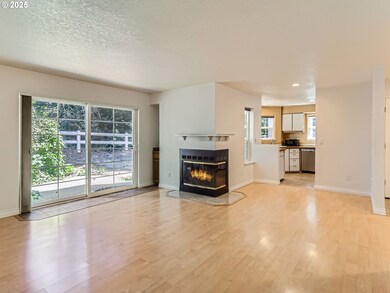
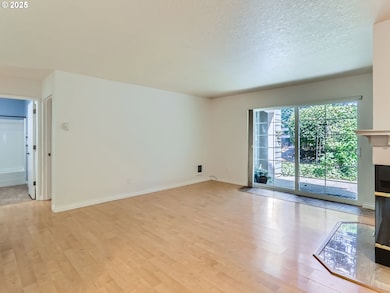
Interior Spaces
- 1,360 Sq Ft Home
- 1-Story Property
- Wood Burning Fireplace
- Double Pane Windows
- Family Room
- Living Room
- Dining Room
- Vinyl Flooring
- Views of Woods
- Crawl Space
Kitchen
- Free-Standing Range
- Dishwasher
- Disposal
Bedrooms and Bathrooms
- 3 Bedrooms
- 2 Full Bathrooms
Laundry
- Laundry Room
- Washer and Dryer
Accessible Home Design
- Accessibility Features
- Level Entry For Accessibility
- Accessible Pathway
Schools
- Eccles Elementary School
- Baker Prairie Middle School
- Canby High School
Utilities
- No Cooling
- Zoned Heating
- Wall Furnace
- Electric Water Heater
- High Speed Internet
Additional Features
- Covered Patio or Porch
- Ground Level
Listing and Financial Details
- Assessor Parcel Number 01852800
Community Details
Overview
- 150 Units
- Charbonneauvillagecondominiums Association, Phone Number (503) 329-2129
- On-Site Maintenance
Amenities
- Common Area
- Party Room
Recreation
- Community Pool
Security
- Resident Manager or Management On Site
Map
Home Values in the Area
Average Home Value in this Area
Tax History
| Year | Tax Paid | Tax Assessment Tax Assessment Total Assessment is a certain percentage of the fair market value that is determined by local assessors to be the total taxable value of land and additions on the property. | Land | Improvement |
|---|---|---|---|---|
| 2025 | $3,280 | $199,369 | -- | -- |
| 2024 | $3,146 | $193,563 | -- | -- |
| 2023 | $3,146 | $187,926 | $0 | $0 |
| 2022 | $2,975 | $182,453 | $0 | $0 |
| 2021 | $2,864 | $177,139 | $0 | $0 |
| 2020 | $2,818 | $171,980 | $0 | $0 |
| 2019 | $2,684 | $166,971 | $0 | $0 |
| 2018 | $2,635 | $162,108 | $0 | $0 |
| 2017 | $2,558 | $157,386 | $0 | $0 |
| 2016 | $2,473 | $152,802 | $0 | $0 |
| 2015 | $2,424 | $148,351 | $0 | $0 |
| 2014 | $2,293 | $144,030 | $0 | $0 |
Property History
| Date | Event | Price | List to Sale | Price per Sq Ft |
|---|---|---|---|---|
| 09/08/2025 09/08/25 | Price Changed | $390,000 | -2.5% | $287 / Sq Ft |
| 07/18/2025 07/18/25 | For Sale | $400,000 | -- | $294 / Sq Ft |
Purchase History
| Date | Type | Sale Price | Title Company |
|---|---|---|---|
| Warranty Deed | $115,000 | Fidelity Natl Title Co Of Or | |
| Interfamily Deed Transfer | -- | Accommodation | |
| Warranty Deed | $157,500 | Fidelity Natl Title Co Of Or | |
| Warranty Deed | $138,950 | Chicago Title |
Mortgage History
| Date | Status | Loan Amount | Loan Type |
|---|---|---|---|
| Previous Owner | $110,250 | Commercial | |
| Previous Owner | $88,300 | No Value Available |
Source: Regional Multiple Listing Service (RMLS)
MLS Number: 367715789
APN: 01852800
Disclaimer: Certain information contained herein is derived from information provided by parties other than Homes.com. All information provided is deemed reliable, but is not guaranteed to be accurate and should be independently verified.
![]() The content relating to real estate for sale on this web site comes in part from the IDX program of the RMLS™ of Portland, Oregon. Real estate listings held by brokerage firms other than Ten-X are marked with the RMLS™ logo, and detailed information about these properties includes the names of the listing brokers. Listing content is copyright © 2025 RMLS™, Portland, Oregon. Some properties which appear for sale on this web site may subsequently have sold or may no longer be available. All information provided is deemed reliable but is not guaranteed and should be independently verified.
The content relating to real estate for sale on this web site comes in part from the IDX program of the RMLS™ of Portland, Oregon. Real estate listings held by brokerage firms other than Ten-X are marked with the RMLS™ logo, and detailed information about these properties includes the names of the listing brokers. Listing content is copyright © 2025 RMLS™, Portland, Oregon. Some properties which appear for sale on this web site may subsequently have sold or may no longer be available. All information provided is deemed reliable but is not guaranteed and should be independently verified.
- 8425 SW Curry Dr
- 8515 SW Curry Dr Unit D
- 31959 SW Charbonneau Dr
- 8062 SW Edgewater W
- 8710 SW Curry Dr
- 32120 SW Boones Bend Rd
- 32082 SW Charbonneau Dr
- 7995 SW Sacajawea Way
- 31150 SW Wallowa Ct
- 31373 SW Chia Loop
- 7725 SW Arbor Lake Ct
- 7705 SW Arbor Lake Ct
- 31090 SW Wallowa Ct
- 7680 SW Arbor Lake Ct
- 8330 SW Rogue Ln
- 7320 SW Arbor Lake Dr
- 32545 SW Juliette Dr
- 14089 NE River Vista Ln
- 7463 SW Lakeside Loop
- 32455 SW Arbor Lake Dr
- 31020 SW Boones Ferry Rd
- 30050 SW Town Center Loop W
- 30480 SW Boones Ferry Rd
- 29700 SW Courtside Dr Unit 43
- 29697 SW Rose Ln
- 29796 SW Montebello Dr
- 10305 SW Wilsonville Rd
- 29252 SW Tami Loop
- 7875 SW Vlahos Dr
- 8750 SW Ash Meadows Rd
- 6600 SW Wilsonville Rd
- 8890 SW Ash Meadows Cir
- 28900 SW Villebois Dr N
- 25800 SW Canyon Creek Rd
- 847 NW 1st Ave
- 111 NW 2nd Ave
- 287 SW 3rd Ave
- 1203 NE Territorial Rd
- 23600 SW Grahams Ferry Rd
- 800 N Pine St
