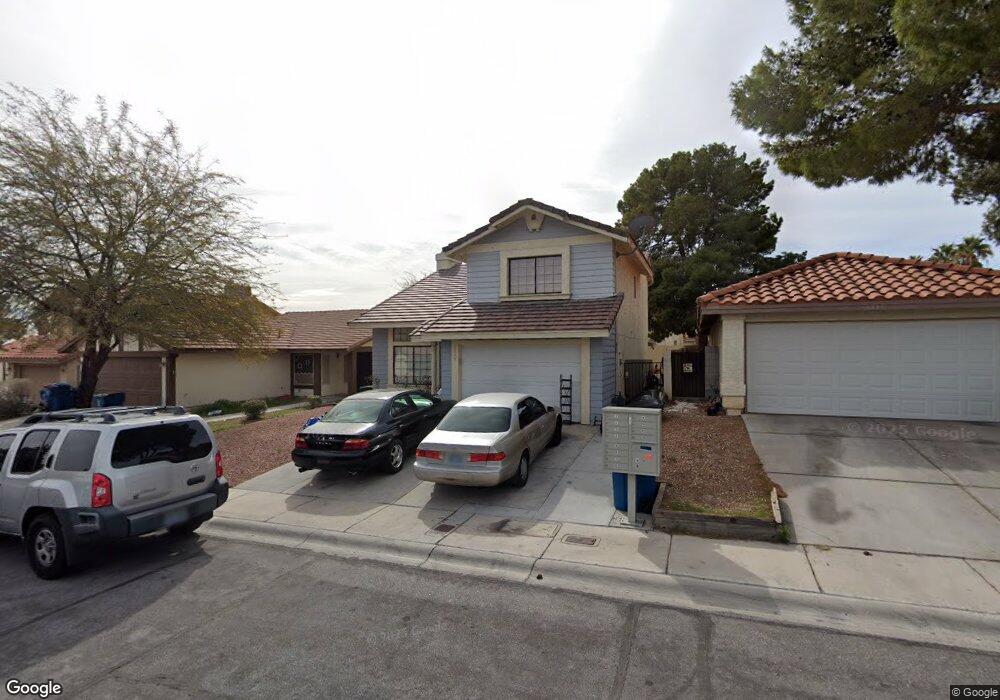
8409 Charles Ct Las Vegas, NV 89145
Angel Park NeighborhoodEstimated Value: $395,904 - $447,000
3
Beds
3
Baths
1,646
Sq Ft
$258/Sq Ft
Est. Value
About This Home
This home is located at 8409 Charles Ct, Las Vegas, NV 89145 and is currently estimated at $424,476, approximately $257 per square foot. 8409 Charles Ct is a home located in Clark County with nearby schools including Walter Jacobson Elementary School, Walter Johnson Junior High School Academy of International Studies, and Bonanza High School.
Ownership History
Date
Name
Owned For
Owner Type
Purchase Details
Closed on
Sep 3, 2025
Sold by
Urbina Manuel and Urbina Margarita
Bought by
Lucero Cesario Urbina
Current Estimated Value
Purchase Details
Closed on
Nov 5, 2010
Sold by
Federal National Mortgage Association
Bought by
Urbina Manuel
Purchase Details
Closed on
Nov 4, 2010
Sold by
Urbina Margarita
Bought by
Urbina Manuel
Purchase Details
Closed on
Feb 4, 2010
Sold by
Castrogiovanni Gaetana T
Bought by
Federal National Mortgage Association
Purchase Details
Closed on
Jun 30, 2005
Sold by
Leedham Janet Larue
Bought by
Castrogiovanni Gaetara T
Home Financials for this Owner
Home Financials are based on the most recent Mortgage that was taken out on this home.
Original Mortgage
$219,900
Interest Rate
5.75%
Mortgage Type
Unknown
Purchase Details
Closed on
Sep 9, 2002
Sold by
Leedham Janet L
Bought by
Leedham Janet Larue and The Janet Larue Leedham Family Trust
Create a Home Valuation Report for This Property
The Home Valuation Report is an in-depth analysis detailing your home's value as well as a comparison with similar homes in the area
Home Values in the Area
Average Home Value in this Area
Purchase History
| Date | Buyer | Sale Price | Title Company |
|---|---|---|---|
| Lucero Cesario Urbina | $197,971 | None Listed On Document | |
| Urbina Manuel | $70,875 | Lawyers Title Of Nevada Cen | |
| Urbina Manuel | -- | Lawyers Title Of Nevada Cen | |
| Federal National Mortgage Association | $250,512 | First American Title Ndts | |
| Castrogiovanni Gaetara T | $274,900 | Equity Title Of Nevada | |
| Leedham Janet Larue | -- | Stewart Title |
Source: Public Records
Mortgage History
| Date | Status | Borrower | Loan Amount |
|---|---|---|---|
| Previous Owner | Castrogiovanni Gaetara T | $219,900 | |
| Closed | Castrogiovanni Gaetara T | $55,000 |
Source: Public Records
Tax History Compared to Growth
Tax History
| Year | Tax Paid | Tax Assessment Tax Assessment Total Assessment is a certain percentage of the fair market value that is determined by local assessors to be the total taxable value of land and additions on the property. | Land | Improvement |
|---|---|---|---|---|
| 2025 | $1,327 | $69,290 | $31,500 | $37,790 |
| 2024 | $1,289 | $69,290 | $31,500 | $37,790 |
| 2023 | $1,352 | $67,302 | $30,450 | $36,852 |
| 2022 | $1,312 | $58,618 | $24,500 | $34,118 |
| 2021 | $1,215 | $55,285 | $22,400 | $32,885 |
| 2020 | $1,126 | $53,953 | $21,000 | $32,953 |
| 2019 | $1,055 | $50,330 | $17,500 | $32,830 |
| 2018 | $1,007 | $47,547 | $15,750 | $31,797 |
| 2017 | $1,526 | $46,544 | $14,000 | $32,544 |
| 2016 | $943 | $44,341 | $11,200 | $33,141 |
| 2015 | $940 | $41,023 | $8,050 | $32,973 |
| 2014 | $911 | $31,584 | $6,475 | $25,109 |
Source: Public Records
Map
Nearby Homes
- 208 Roland Wiley Rd
- 8305 Cherry Glaze Ave Unit 203
- 104 Breezy Tree Ct Unit 202
- 121 Golf Range St
- 8233 Ducharme Ave
- 350 S Durango Dr Unit 234
- 8224 Crystal Star Ct
- 8212 Buccaneer Ln
- 8220 Abercrombe Way
- 8252 Illusion Ct
- 8537 Highland View Ave
- 8616 Crest Hill Ave
- 369 Tobler Dr
- 508 Indian Princess Dr Unit 102
- 508 Indian Princess Dr Unit 202
- 8409 Running Deer Ave Unit 104
- 8417 Running Deer Ave Unit 101
- 8425 Running Deer Ave Unit 104
- 8009 Celebreeze Ct
- 525 Indian Princess Dr Unit 101
- 8405 Charles Ct
- 8413 Charles Ct
- 8417 Charles Ct
- 8401 Charles Ct
- 8408 Dunphy Ct
- 8404 Dunphy Ct
- 8412 Dunphy Ct
- 8421 Charles Ct
- 8400 Dunphy Ct
- 8416 Dunphy Ct Unit 2
- 8408 Charles Ct
- 8412 Charles Ct
- 8404 Charles Ct
- 8420 Dunphy Ct
- 8425 Charles Ct
- 8416 Charles Ct
- 8400 Charles Ct
- 8420 Charles Ct
- 8424 Dunphy Ct
- 8429 Charles Ct