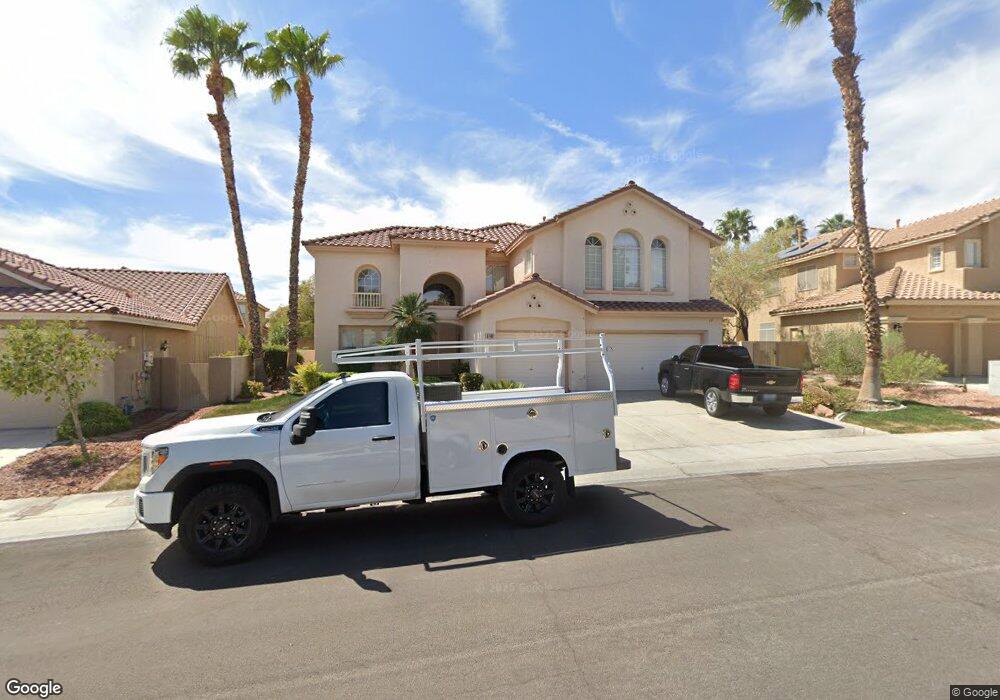
8409 Eagle Eye Ave Unit n Las Vegas, NV 89128
Summerlin NeighborhoodEstimated Value: $781,962
5
Beds
4
Baths
3,538
Sq Ft
$221/Sq Ft
Est. Value
About This Home
This home is located at 8409 Eagle Eye Ave Unit n, Las Vegas, NV 89128 and is currently priced at $781,962, approximately $221 per square foot. 8409 Eagle Eye Ave Unit n is a home located in Clark County with nearby schools including Richard H. Bryan Elementary School, Ernest Becker Middle School, and Cimarron Memorial High School.
Ownership History
Date
Name
Owned For
Owner Type
Purchase Details
Closed on
Dec 9, 2015
Sold by
Tom Marshall E and Carta Laurie J
Bought by
Ih6 Property Nevada Lp
Current Estimated Value
Purchase Details
Closed on
Jun 4, 2007
Sold by
The Fink Family Trust
Bought by
Tom Marshall E and Carta Laurie J
Home Financials for this Owner
Home Financials are based on the most recent Mortgage that was taken out on this home.
Original Mortgage
$417,000
Interest Rate
6.14%
Mortgage Type
Unknown
Purchase Details
Closed on
Mar 25, 2002
Sold by
Fink Steven and Fink Risa
Bought by
Fink Steven and Fink Risa
Purchase Details
Closed on
Jun 19, 1995
Sold by
Pacific Homes
Bought by
Fink Steven and Fink Risa
Home Financials for this Owner
Home Financials are based on the most recent Mortgage that was taken out on this home.
Original Mortgage
$193,550
Interest Rate
7.92%
Create a Home Valuation Report for This Property
The Home Valuation Report is an in-depth analysis detailing your home's value as well as a comparison with similar homes in the area
Home Values in the Area
Average Home Value in this Area
Purchase History
| Date | Buyer | Sale Price | Title Company |
|---|---|---|---|
| Ih6 Property Nevada Lp | $365,000 | Ticor Title Las Vegas | |
| Tom Marshall E | $570,000 | Nevada Title Company | |
| Fink Steven | -- | -- | |
| Fink Steven | $248,500 | United Title |
Source: Public Records
Mortgage History
| Date | Status | Borrower | Loan Amount |
|---|---|---|---|
| Previous Owner | Tom Marshall E | $417,000 | |
| Previous Owner | Fink Steven | $193,550 |
Source: Public Records
Tax History Compared to Growth
Tax History
| Year | Tax Paid | Tax Assessment Tax Assessment Total Assessment is a certain percentage of the fair market value that is determined by local assessors to be the total taxable value of land and additions on the property. | Land | Improvement |
|---|---|---|---|---|
| 2025 | $4,625 | $157,907 | $55,650 | $102,257 |
| 2024 | $4,283 | $157,907 | $55,650 | $102,257 |
| 2023 | $4,283 | $147,947 | $50,050 | $97,897 |
| 2022 | $3,966 | $134,558 | $45,150 | $89,408 |
| 2021 | $3,673 | $124,196 | $38,850 | $85,346 |
| 2020 | $3,407 | $120,874 | $36,050 | $84,824 |
| 2019 | $3,193 | $115,063 | $31,150 | $83,913 |
| 2018 | $3,047 | $111,104 | $30,800 | $80,304 |
| 2017 | $3,583 | $109,271 | $27,650 | $81,621 |
| 2016 | $2,852 | $104,745 | $23,450 | $81,295 |
| 2015 | $2,846 | $101,320 | $21,000 | $80,320 |
| 2014 | $2,758 | $81,604 | $16,100 | $65,504 |
Source: Public Records
Map
Nearby Homes
- 8412 Eagle Eye Ave
- 1604 Desert Fort St
- 1717 Double Arrow Place
- 8420 Desert Quail Dr
- 1720 Plata Pico Dr
- 1512 Couples St
- 1501 Faldo St Unit 2
- 8414 Elkington Ave
- 1716 Double Arch Ct
- 1721 Mill Canyon Dr
- 1417 Astronomy Cir
- 8612 Sierra Cima Ln
- 8205 Ruby Mountain Way
- 1308 Dusty Creek St
- 8336 Sedona Sunrise Dr
- 1236 Dusty Creek St
- 8229 Sedona Sunrise Dr
- 8721 Red Brook Dr Unit 203
- 8112 Hercules Dr
- 8232 Sedona Sunrise Dr
- 8409 Eagle Eye Ave Unit none
- 8409 Eagle Eye Ave
- 8405 Eagle Eye Ave
- 8413 Eagle Eye Ave
- 8408 Willow Point Ct Unit 1
- 8412 Willow Point Ct
- 8404 Willow Point Ct
- 8401 Eagle Eye Ave
- 8408 Eagle Eye Ave Unit 1
- 8416 Willow Point Ct Unit 1
- 8417 Eagle Eye Ave
- 1621 Desert Fort St
- 8400 Willow Point Ct
- 8420 Willow Point Ct
- 1621 Double Arrow Place
- 1625 Desert Fort St
- 1620 Double Arrow Place Unit 1
- 8409 Willow Point Ct
- 8424 Willow Point Ct
- 8413 Willow Point Ct