Estimated Value: $135,788
Studio
4
Baths
1,440
Sq Ft
$94/Sq Ft
Est. Value
About This Home
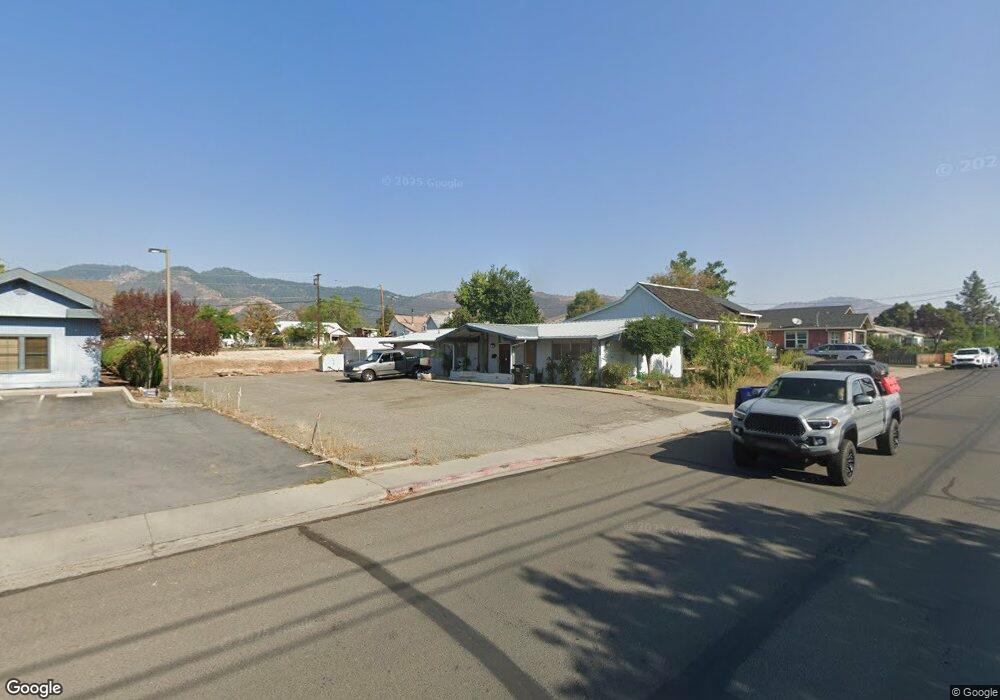
This home is located at 841 4th St, Yreka, CA 96097 and is currently priced at $135,788, approximately $94 per square foot. 841 4th St is a home located in Siskiyou County with nearby schools including Evergreen Elementary School, Jackson Street Elementary School, and Yreka High School.
Ownership History
Date
Name
Owned For
Owner Type
Purchase Details
Closed on
Jul 26, 2023
Sold by
Pettitt Susan M
Bought by
Pettitt Jonathan P
Current Estimated Value
Home Financials for this Owner
Home Financials are based on the most recent Mortgage that was taken out on this home.
Original Mortgage
$80,000
Outstanding Balance
$77,566
Interest Rate
6.69%
Mortgage Type
Seller Take Back
Purchase Details
Closed on
Feb 18, 2016
Sold by
Derouchey Louis E and Derouchey Amanda S
Bought by
Siskiyou Central Credit Union
Create a Home Valuation Report for This Property
The Home Valuation Report is an in-depth analysis detailing your home's value as well as a comparison with similar homes in the area
Home Values in the Area
Average Home Value in this Area
Purchase History
| Date | Buyer | Sale Price | Title Company |
|---|---|---|---|
| Pettitt Jonathan P | -- | Mt Shasta Title | |
| Pettitt Jonathan P | $105,000 | Mt Shasta Title & Escrow | |
| Siskiyou Central Credit Union | $84,500 | Mt Shasta Title & Escrow Co |
Source: Public Records
Mortgage History
| Date | Status | Borrower | Loan Amount |
|---|---|---|---|
| Open | Pettitt Jonathan P | $80,000 |
Source: Public Records
Tax History
| Year | Tax Paid | Tax Assessment Tax Assessment Total Assessment is a certain percentage of the fair market value that is determined by local assessors to be the total taxable value of land and additions on the property. | Land | Improvement |
|---|---|---|---|---|
| 2025 | $1,098 | $107,100 | $30,600 | $76,500 |
| 2023 | $1,098 | $119,468 | $34,133 | $85,335 |
| 2022 | $1,226 | $117,126 | $33,464 | $83,662 |
| 2021 | $1,205 | $114,830 | $32,808 | $82,022 |
| 2020 | $1,197 | $113,653 | $32,472 | $81,181 |
| 2019 | $1,176 | $111,426 | $31,836 | $79,590 |
| 2018 | $1,153 | $109,242 | $31,212 | $78,030 |
| 2017 | $1,132 | $107,100 | $30,600 | $76,500 |
| 2016 | $1,022 | $97,060 | $25,282 | $71,778 |
| 2015 | -- | $95,603 | $24,903 | $70,700 |
| 2014 | $970 | $93,732 | $24,416 | $69,316 |
Source: Public Records
Map
Nearby Homes
Your Personal Tour Guide
Ask me questions while you tour the home.