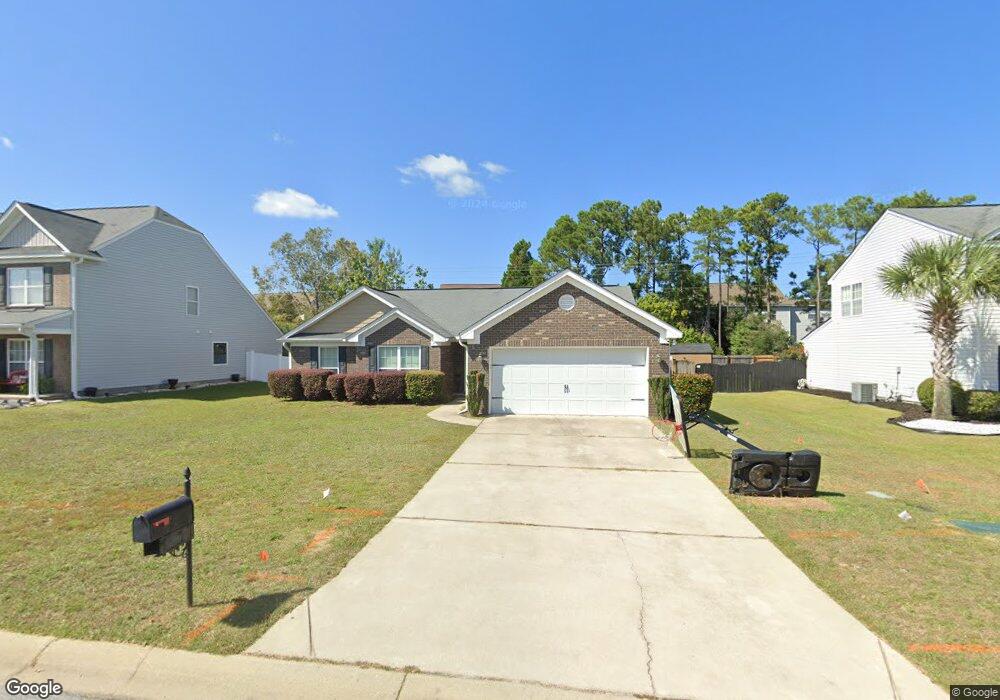
841 Brickingham Way Columbia, SC 29229
Northeast Columbia NeighborhoodEstimated Value: $235,000 - $271,000
3
Beds
2
Baths
1,778
Sq Ft
$138/Sq Ft
Est. Value
About This Home
This home is located at 841 Brickingham Way, Columbia, SC 29229 and is currently estimated at $244,854, approximately $137 per square foot. 841 Brickingham Way is a home located in Richland County with nearby schools including North Springs Elementary School, Summit Parkway Middle School, and Ridge View High School.
Ownership History
Date
Name
Owned For
Owner Type
Purchase Details
Closed on
Jul 21, 2021
Sold by
Robinson Jacquia L
Bought by
Gamble Crystal
Current Estimated Value
Home Financials for this Owner
Home Financials are based on the most recent Mortgage that was taken out on this home.
Original Mortgage
$181,649
Outstanding Balance
$164,894
Interest Rate
2.93%
Mortgage Type
FHA
Estimated Equity
$79,960
Purchase Details
Closed on
May 31, 2013
Sold by
Chapman Francine
Bought by
Robinson Jacquia L
Home Financials for this Owner
Home Financials are based on the most recent Mortgage that was taken out on this home.
Original Mortgage
$151,962
Interest Rate
3.43%
Mortgage Type
VA
Purchase Details
Closed on
Jun 28, 2010
Sold by
Essex Homes Southeast Inc
Bought by
Chapman Francine
Home Financials for this Owner
Home Financials are based on the most recent Mortgage that was taken out on this home.
Original Mortgage
$154,398
Interest Rate
4.83%
Mortgage Type
VA
Create a Home Valuation Report for This Property
The Home Valuation Report is an in-depth analysis detailing your home's value as well as a comparison with similar homes in the area
Home Values in the Area
Average Home Value in this Area
Purchase History
| Date | Buyer | Sale Price | Title Company |
|---|---|---|---|
| Gamble Crystal | $185,000 | First American Mortgage Sln | |
| Robinson Jacquia L | $148,500 | None Available | |
| Chapman Francine | $151,149 | -- |
Source: Public Records
Mortgage History
| Date | Status | Borrower | Loan Amount |
|---|---|---|---|
| Open | Gamble Crystal | $181,649 | |
| Previous Owner | Robinson Jacquia L | $151,962 | |
| Previous Owner | Chapman Francine | $154,398 |
Source: Public Records
Tax History Compared to Growth
Tax History
| Year | Tax Paid | Tax Assessment Tax Assessment Total Assessment is a certain percentage of the fair market value that is determined by local assessors to be the total taxable value of land and additions on the property. | Land | Improvement |
|---|---|---|---|---|
| 2023 | $2,076 | $0 | $0 | $0 |
| 2021 | $324 | $5,152 | $1,140 | $4,012 |
| 2020 | $324 | $0 | $0 | $0 |
| 2019 | $1,396 | $5,150 | $0 | $0 |
| 2018 | $1,567 | $5,940 | $0 | $0 |
| 2017 | $5,151 | $8,910 | $0 | $0 |
| 2016 | $1,531 | $5,940 | $0 | $0 |
| 2015 | $4,994 | $8,910 | $0 | $0 |
| 2014 | $4,932 | $148,500 | $0 | $0 |
| 2013 | -- | $5,940 | $0 | $0 |
Source: Public Records
Map
Nearby Homes
- 203 May Oak Rd
- 316 May Oak Rd
- 5 Newquay Ct
- 1303 May Oak Cir
- 167 Frasier Fir Ln
- 314 Fernview Dr
- 1229 Waverly Place Dr
- 231 Fernview Dr
- 510 Timber Crest Dr
- 1 Duffie Ct
- 8 Scottsdale Ct
- 323 E Waverly Place Ct
- 1306 Waverly Place Dr
- 215 Faircrest Way
- 312 Alderston Way
- 108 Malisa Dr
- 309 Underhill Dr
- 314 Underhill Dr
- 331 Underhill Dr
- 47 Glen Knoll Place
- 845 Brickingham Way
- 601 Bur Oak Ln
- 912 Heyward Brockington Rd
- 917 Heyward Brockington Rd
- 849 Brickingham Way
- 600 Bur Oak Ln
- 604 Bur Oak Ln
- 837 Brickingham Way
- 853 Brickingham Way
- 857 Brickingham Way
- 605 Bur Oak Ln
- 12 May Oak Ct
- 14 May Oak Ct
- 10 May Oak Ct
- 100 Frasier Fir Ln
- 833 Brickingham Way
- 8 May Oak Ct
- 104 Frasier Fir Ln
- 306 Crest Haven Dr
- 861 Brickingham Way