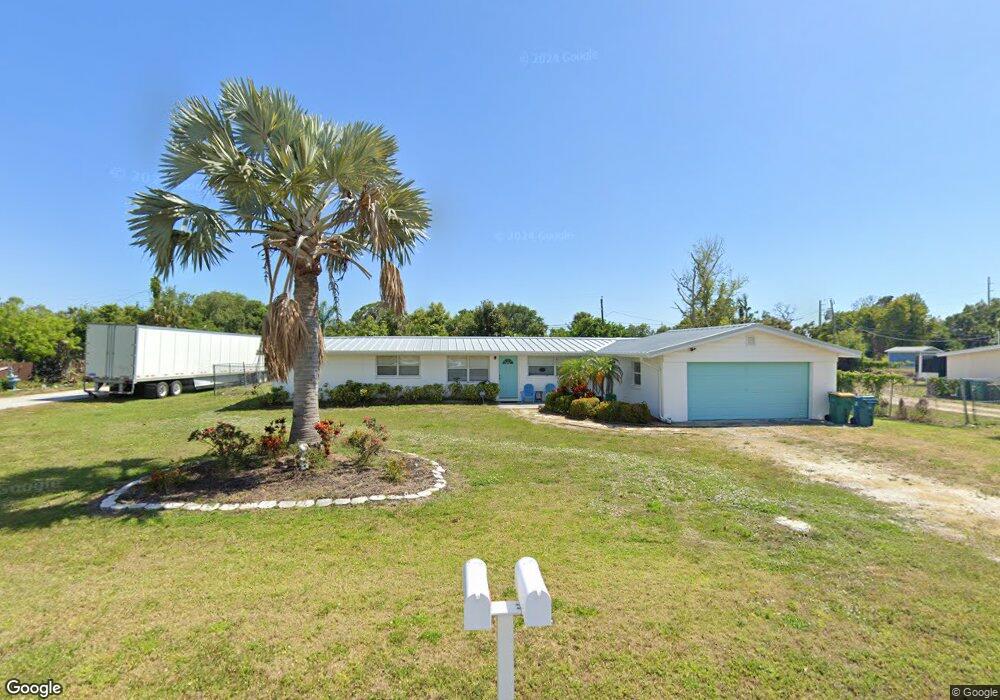
841 E 2nd St Englewood, FL 34223
Englewood South NeighborhoodEstimated Value: $196,778 - $271,000
2
Beds
1
Bath
1,056
Sq Ft
$221/Sq Ft
Est. Value
About This Home
This home is located at 841 E 2nd St, Englewood, FL 34223 and is currently estimated at $233,195, approximately $220 per square foot. 841 E 2nd St is a home located in Charlotte County with nearby schools including Myakka River Elementary School, L.A. Ainger Middle School, and Lemon Bay High School.
Ownership History
Date
Name
Owned For
Owner Type
Purchase Details
Closed on
May 1, 2008
Sold by
Hud
Bought by
Warth Russell
Current Estimated Value
Home Financials for this Owner
Home Financials are based on the most recent Mortgage that was taken out on this home.
Original Mortgage
$49,305
Interest Rate
5.82%
Mortgage Type
Purchase Money Mortgage
Purchase Details
Closed on
Oct 31, 2007
Sold by
Midfirst Bank
Bought by
Hud
Purchase Details
Closed on
Sep 14, 2007
Sold by
Mitchell Andrew O and Mitchell April D
Bought by
Midfirst Bank
Purchase Details
Closed on
Aug 31, 1999
Sold by
Dean Jeffrey R P and Dean Kimberly
Bought by
Mitchell Andrew O and Mitchell April D
Home Financials for this Owner
Home Financials are based on the most recent Mortgage that was taken out on this home.
Original Mortgage
$55,828
Interest Rate
7.5%
Mortgage Type
FHA
Create a Home Valuation Report for This Property
The Home Valuation Report is an in-depth analysis detailing your home's value as well as a comparison with similar homes in the area
Home Values in the Area
Average Home Value in this Area
Purchase History
| Date | Buyer | Sale Price | Title Company |
|---|---|---|---|
| Warth Russell | $51,900 | Lawyers Advantage Title Grou | |
| Hud | -- | None Available | |
| Midfirst Bank | -- | Attorney | |
| Mitchell Andrew O | $56,000 | -- |
Source: Public Records
Mortgage History
| Date | Status | Borrower | Loan Amount |
|---|---|---|---|
| Closed | Warth Russell | $49,305 | |
| Previous Owner | Mitchell Andrew O | $55,828 |
Source: Public Records
Tax History
| Year | Tax Paid | Tax Assessment Tax Assessment Total Assessment is a certain percentage of the fair market value that is determined by local assessors to be the total taxable value of land and additions on the property. | Land | Improvement |
|---|---|---|---|---|
| 2025 | $1,863 | $165,466 | -- | -- |
| 2023 | $2,606 | $156,119 | $0 | $0 |
| 2022 | $2,503 | $151,572 | $0 | $0 |
| 2021 | $2,478 | $147,157 | $23,219 | $123,938 |
| 2020 | $3,093 | $141,275 | $20,487 | $120,788 |
| 2019 | $3,043 | $123,900 | $20,487 | $103,413 |
| 2018 | $1,300 | $52,874 | $0 | $0 |
| 2017 | $1,293 | $51,786 | $0 | $0 |
| 2016 | $1,161 | $50,721 | $0 | $0 |
| 2015 | $1,136 | $50,368 | $0 | $0 |
| 2014 | $1,109 | $49,968 | $0 | $0 |
Source: Public Records
Map
Nearby Homes
- 801 E 2nd St
- 1780 Elinor Place
- 1796 Florence Ave
- 879 E 2nd St
- 1765 Loralin Dr
- 1756 Elinor Place
- 1735 Loralin Dr
- 832 E 4th St
- 801 E 5th St
- 825 E 5th St
- 1710 Florence Ave
- 857 E 3rd St
- 848 E 4th St
- 817 E 6th St
- 1665 Florence Ave
- 1340 Manor Rd
- 1005 Alston Ln
- 1239 Punta Nova Terrace
- 893 E 4th St
- 2035 S Mccall Rd
Your Personal Tour Guide
Ask me questions while you tour the home.