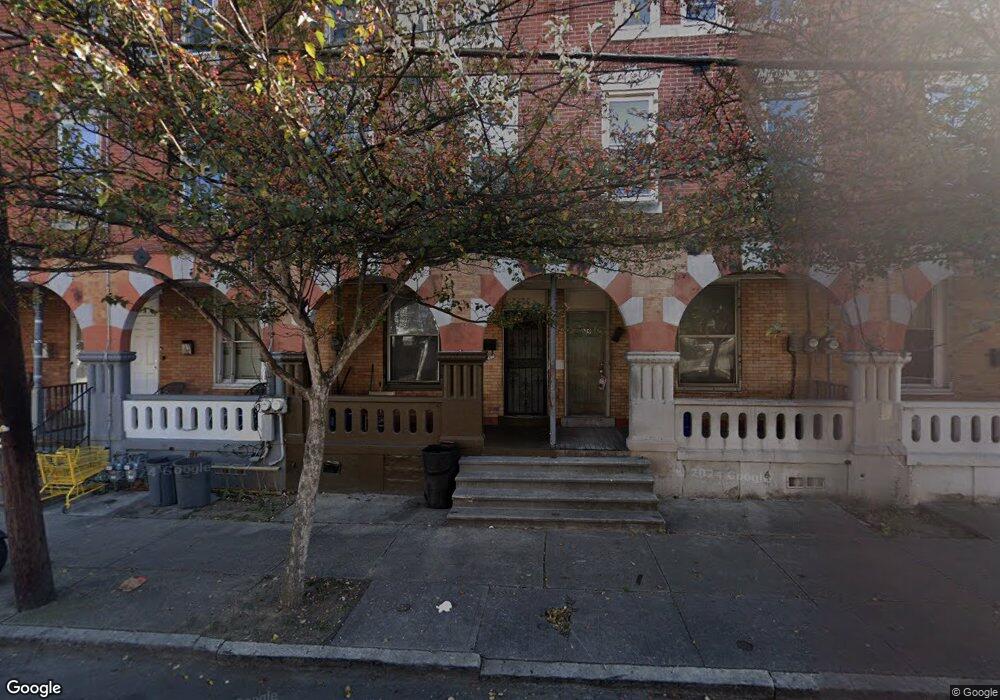
841 E State St Trenton, NJ 08609
Wilbur NeighborhoodEstimated Value: $103,000 - $269,000
--
Bed
--
Bath
1,846
Sq Ft
$93/Sq Ft
Est. Value
About This Home
This home is located at 841 E State St, Trenton, NJ 08609 and is currently estimated at $170,858, approximately $92 per square foot. 841 E State St is a home located in Mercer County with nearby schools including P.J. Hill Elementary School, Grant Elementary School, and Trenton Central High School - Main Campus.
Ownership History
Date
Name
Owned For
Owner Type
Purchase Details
Closed on
Dec 30, 2013
Sold by
Ward Shirley and Wallace Shirley
Bought by
Ward Shirley
Current Estimated Value
Home Financials for this Owner
Home Financials are based on the most recent Mortgage that was taken out on this home.
Original Mortgage
$96,000
Outstanding Balance
$68,910
Interest Rate
3.16%
Mortgage Type
Reverse Mortgage Home Equity Conversion Mortgage
Estimated Equity
$101,948
Purchase Details
Closed on
Nov 5, 2009
Sold by
Better Community Housing Trenton Inc
Bought by
Wallace Shirley
Home Financials for this Owner
Home Financials are based on the most recent Mortgage that was taken out on this home.
Interest Rate
4.98%
Create a Home Valuation Report for This Property
The Home Valuation Report is an in-depth analysis detailing your home's value as well as a comparison with similar homes in the area
Home Values in the Area
Average Home Value in this Area
Purchase History
| Date | Buyer | Sale Price | Title Company |
|---|---|---|---|
| Ward Shirley | -- | None Available | |
| Wallace Shirley | -- | -- |
Source: Public Records
Mortgage History
| Date | Status | Borrower | Loan Amount |
|---|---|---|---|
| Open | Ward Shirley | $96,000 | |
| Closed | Wallace Shirley | -- |
Source: Public Records
Tax History Compared to Growth
Tax History
| Year | Tax Paid | Tax Assessment Tax Assessment Total Assessment is a certain percentage of the fair market value that is determined by local assessors to be the total taxable value of land and additions on the property. | Land | Improvement |
|---|---|---|---|---|
| 2025 | $2,199 | $37,900 | $5,600 | $32,300 |
| 2024 | $2,110 | $37,900 | $5,600 | $32,300 |
| 2023 | $2,110 | $37,900 | $5,600 | $32,300 |
| 2022 | $2,069 | $37,900 | $5,600 | $32,300 |
| 2021 | $2,105 | $37,900 | $5,600 | $32,300 |
| 2020 | $2,098 | $37,900 | $5,600 | $32,300 |
| 2019 | $2,064 | $37,900 | $5,600 | $32,300 |
| 2018 | $3,289 | $63,100 | $5,600 | $57,500 |
| 2017 | $3,127 | $63,100 | $5,600 | $57,500 |
| 2016 | $1,300 | $22,600 | $7,400 | $15,200 |
| 2015 | $1,296 | $22,600 | $7,400 | $15,200 |
| 2014 | $1,290 | $22,600 | $7,400 | $15,200 |
Source: Public Records
Map
Nearby Homes