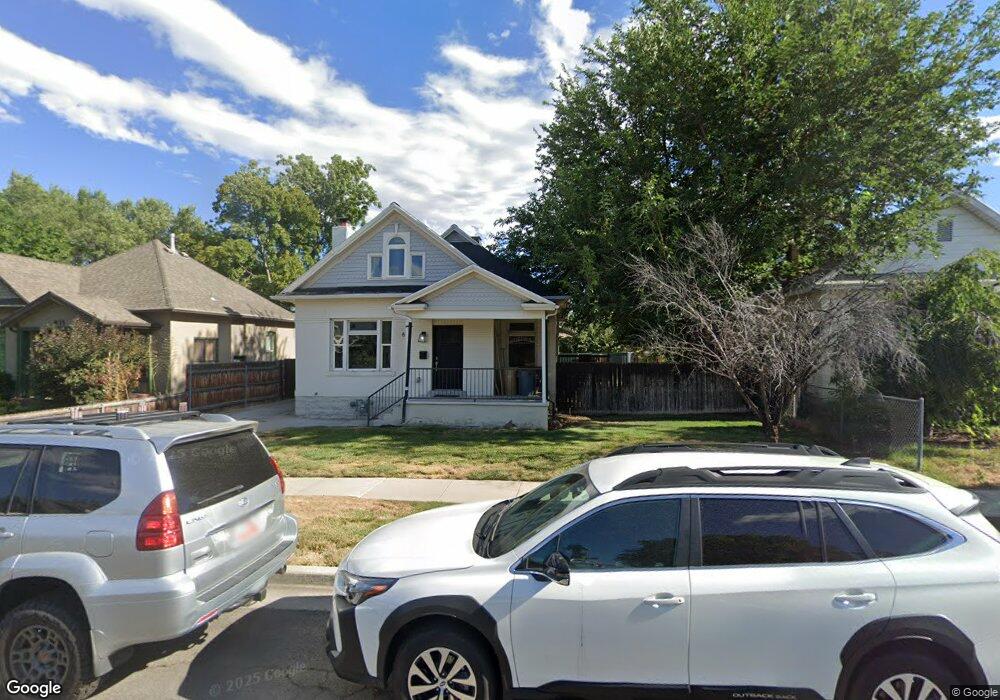
841 E Wilmington Ave Salt Lake City, UT 84106
Sugar House NeighborhoodEstimated Value: $758,000 - $896,000
4
Beds
2
Baths
3,512
Sq Ft
$234/Sq Ft
Est. Value
About This Home
This home is located at 841 E Wilmington Ave, Salt Lake City, UT 84106 and is currently estimated at $822,719, approximately $234 per square foot. 841 E Wilmington Ave is a home located in Salt Lake County with nearby schools including Nibley Park School, Highland High School, and Kearns-Saint Ann Catholic School.
Ownership History
Date
Name
Owned For
Owner Type
Purchase Details
Closed on
Mar 1, 2017
Sold by
Petrie David and Petrie Jo Ann
Bought by
Harrington Vern and Harrington Kelli
Current Estimated Value
Home Financials for this Owner
Home Financials are based on the most recent Mortgage that was taken out on this home.
Original Mortgage
$3,500,000
Outstanding Balance
$2,904,000
Interest Rate
4.19%
Mortgage Type
New Conventional
Estimated Equity
-$2,081,281
Purchase Details
Closed on
Jun 23, 2016
Sold by
Treehouse Investments Llc
Bought by
Petrie David and Petrie Jo Ann
Purchase Details
Closed on
May 20, 2016
Sold by
Bettinson Christoper R
Bought by
Treehouse Investments Llc
Purchase Details
Closed on
Sep 15, 2007
Sold by
Bettinson Gregory Kent and Neil Bettinson David O
Bought by
Bettinson Christopher R
Purchase Details
Closed on
Sep 3, 2002
Sold by
Bettinson Harry O and Bettinson Gregory Kent
Bought by
The Harry O Bettinson Trust
Purchase Details
Closed on
Jul 17, 2002
Sold by
Bettinson Harry O
Bought by
Bettinson Harry O and Bettinson Gregory Kent
Create a Home Valuation Report for This Property
The Home Valuation Report is an in-depth analysis detailing your home's value as well as a comparison with similar homes in the area
Home Values in the Area
Average Home Value in this Area
Purchase History
| Date | Buyer | Sale Price | Title Company |
|---|---|---|---|
| Harrington Vern | -- | Artisan Title | |
| Petrie David | -- | Richland Title Ins Agency In | |
| Treehouse Investments Llc | -- | Richland Title Ins Agncy Inc | |
| Bettinson Christopher R | -- | Pioneer Title Ins Agcy | |
| The Harry O Bettinson Trust | -- | -- | |
| Bettinson Harry O | -- | -- |
Source: Public Records
Mortgage History
| Date | Status | Borrower | Loan Amount |
|---|---|---|---|
| Open | Harrington Vern | $3,500,000 |
Source: Public Records
Tax History Compared to Growth
Tax History
| Year | Tax Paid | Tax Assessment Tax Assessment Total Assessment is a certain percentage of the fair market value that is determined by local assessors to be the total taxable value of land and additions on the property. | Land | Improvement |
|---|---|---|---|---|
| 2025 | $4,232 | $864,100 | $182,900 | $681,200 |
| 2024 | $4,232 | $807,500 | $173,100 | $634,400 |
| 2023 | $4,035 | $742,100 | $166,500 | $575,600 |
| 2022 | $4,362 | $752,600 | $163,200 | $589,400 |
| 2021 | $3,798 | $593,300 | $123,600 | $469,700 |
| 2020 | $3,876 | $576,300 | $110,400 | $465,900 |
| 2019 | $3,943 | $551,600 | $97,100 | $454,500 |
| 2018 | $3,451 | $470,200 | $97,100 | $373,100 |
| 2017 | $3,704 | $472,800 | $97,100 | $375,700 |
| 2016 | $1,714 | $207,800 | $81,600 | $126,200 |
| 2015 | $1,773 | $203,700 | $77,500 | $126,200 |
| 2014 | $1,688 | $192,400 | $75,900 | $116,500 |
Source: Public Records
Map
Nearby Homes
- 2172 S 800 E
- 1978 S Windsor St
- 672 E Redondo Ave
- 841 Ramona Ave
- 2118 S Green St
- 2123 S 600 E
- 2430 S 800 E
- 653 E Hollywood Ave
- 2331 S 600 E Unit A & B
- 1979 S 600 E
- 1042 E Ramona Ave
- 617 E Driggs Ave
- 535 Wilmington Ave
- 1843 S 900 E
- 2233 S 500 E Unit 105
- 2233 S 500 E Unit 111
- 526 E Commonwealth Ave
- 2487 S 800 E
- 536 Hollywood Ave
- 536 E Hollywood Ave
- 841 Wilmington Ave
- 835 Wilmington Ave
- 835 E Wilmington Ave
- 845 Wilmington Ave
- 829 Wilmington Ave
- 853 Wilmington Ave
- 840 Elm Ave
- 844 Elm Ave
- 827 E Wilmington Ave
- 836 Elm Ave
- 840 E Elm Ave
- 827 Wilmington Ave
- 850 Elm Ave
- 830 Elm Ave
- 861 Wilmington Ave
- 854 Elm Ave
- 826 Elm Ave
- 826 E Elm Ave
- 825 Wilmington Ave
- 844 E Wilmington Ave