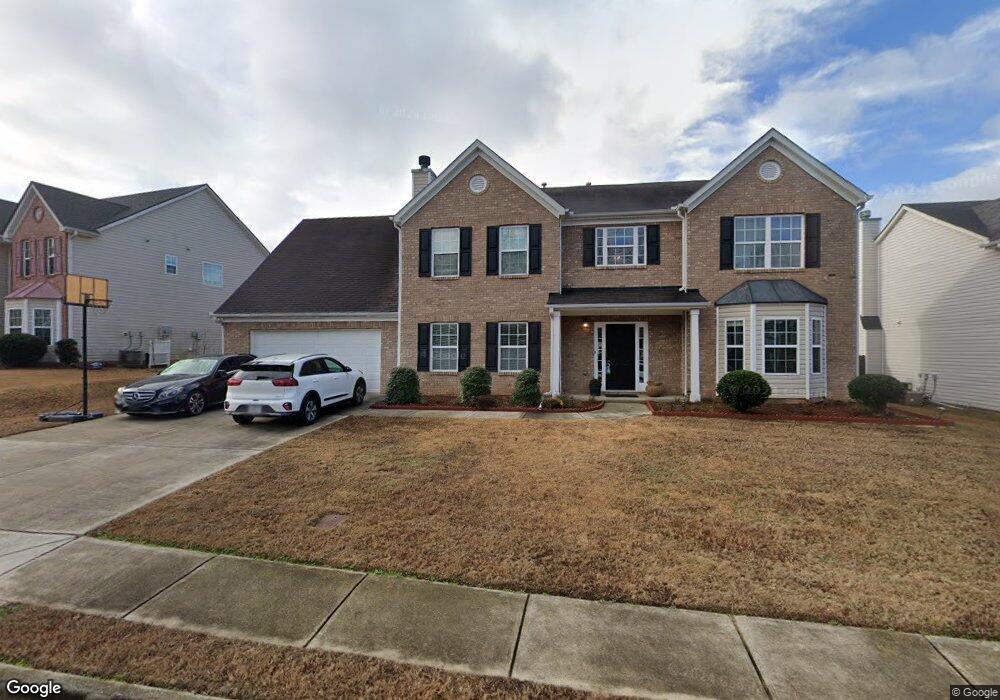
841 Holly Meadow Dr Unit 74 Buford, GA 30518
Estimated Value: $488,000 - $538,000
4
Beds
4
Baths
3,305
Sq Ft
$157/Sq Ft
Est. Value
About This Home
This home is located at 841 Holly Meadow Dr Unit 74, Buford, GA 30518 and is currently estimated at $518,058, approximately $156 per square foot. 841 Holly Meadow Dr Unit 74 is a home located in Gwinnett County with nearby schools including Sugar Hill Elementary School, Lanier Middle School, and Lanier High School.
Ownership History
Date
Name
Owned For
Owner Type
Purchase Details
Closed on
Aug 8, 2025
Sold by
Lu Weichao
Bought by
Jung Robert M and Jung Sonia S
Current Estimated Value
Home Financials for this Owner
Home Financials are based on the most recent Mortgage that was taken out on this home.
Original Mortgage
$375,000
Outstanding Balance
$374,675
Interest Rate
6.72%
Mortgage Type
New Conventional
Estimated Equity
$143,383
Purchase Details
Closed on
Dec 30, 2019
Sold by
Sun Pak Woe
Bought by
Lu Weichao
Home Financials for this Owner
Home Financials are based on the most recent Mortgage that was taken out on this home.
Original Mortgage
$167,500
Interest Rate
3.6%
Mortgage Type
New Conventional
Purchase Details
Closed on
Jul 15, 2011
Sold by
Bradley Lance P
Bought by
Pak Woe S and Pak Su D
Purchase Details
Closed on
May 7, 2011
Sold by
Lowville Relocation Corp
Bought by
Bradley Lance P
Purchase Details
Closed on
May 3, 2011
Sold by
Gober Linda D
Bought by
Lowville Relocation Corp
Purchase Details
Closed on
Jun 4, 2004
Sold by
D G Jenkins Dev Corp
Bought by
Pelky Linda D
Home Financials for this Owner
Home Financials are based on the most recent Mortgage that was taken out on this home.
Original Mortgage
$203,355
Interest Rate
6.25%
Mortgage Type
VA
Create a Home Valuation Report for This Property
The Home Valuation Report is an in-depth analysis detailing your home's value as well as a comparison with similar homes in the area
Home Values in the Area
Average Home Value in this Area
Purchase History
| Date | Buyer | Sale Price | Title Company |
|---|---|---|---|
| Jung Robert M | $500,000 | -- | |
| Lu Weichao | $292,000 | -- | |
| Pak Woe S | $145,000 | -- | |
| Bradley Lance P | $114,000 | -- | |
| Lowville Relocation Corp | $111,801 | -- | |
| Pelky Linda D | $206,600 | -- |
Source: Public Records
Mortgage History
| Date | Status | Borrower | Loan Amount |
|---|---|---|---|
| Open | Jung Robert M | $375,000 | |
| Previous Owner | Lu Weichao | $167,500 | |
| Previous Owner | Pelky Linda D | $203,355 |
Source: Public Records
Tax History
| Year | Tax Paid | Tax Assessment Tax Assessment Total Assessment is a certain percentage of the fair market value that is determined by local assessors to be the total taxable value of land and additions on the property. | Land | Improvement |
|---|---|---|---|---|
| 2025 | $7,846 | $213,200 | $50,000 | $163,200 |
| 2024 | $6,861 | $182,920 | $35,200 | $147,720 |
| 2023 | $6,861 | $182,920 | $35,200 | $147,720 |
| 2022 | $6,026 | $160,320 | $28,000 | $132,320 |
| 2021 | $4,933 | $127,520 | $24,000 | $103,520 |
| 2020 | $4,486 | $114,400 | $20,000 | $94,400 |
| 2019 | $4,320 | $114,400 | $20,000 | $94,400 |
| 2018 | $4,143 | $109,200 | $20,000 | $89,200 |
| 2016 | $3,796 | $98,840 | $17,360 | $81,480 |
| 2015 | $3,265 | $82,680 | $12,000 | $70,680 |
| 2014 | -- | $82,680 | $12,000 | $70,680 |
Source: Public Records
Map
Nearby Homes
- 769 Roxholly Ln
- 661 Roxtree Ct Unit 1
- 665 Roxford Ln Unit 3
- 3811 Roxfield Dr
- 3945 Summit Gate Dr Unit B
- 4003 Roxberry Hill Ln
- 3725 Roxwood Park Dr Unit 1
- 3540 Sentry View Trace Unit 2
- 462 Rutlidge Park Ln
- 3612 Brookefall Ct
- 3635 Hickory Branch Trail
- 955 Laura Jean Ct
- 3998 Oak Crossing Dr NE
- 3972 Golden Gate Way
- 3979 Two Bridge Dr
- 337 Vista Lake Dr
- 3795 Regal Oaks Dr Unit 1
- 4071 Woodward Walk Ln
- 881 Creekview Bluff Way
- 446 Canterbury Place Dr Unit 1
- 831 Holly Meadow Dr
- 898 Roxholly Ln
- 878 Roxholly Ln
- 821 Holly Meadow Dr Unit 2
- 858 Roxholly Ln Unit 3
- 842 Holly Meadow Dr
- 852 Holly Meadow Dr
- 832 Holly Meadow Dr
- 862 Holly Meadow Dr Unit 2
- 838 Roxholly Ln
- 822 Holly Meadow Dr
- 822 Holly Meadow Dr Unit 1
- 818 Roxholly Ln Unit 3
- 889 Roxholly Ln
- 811 Holly Meadow Dr Unit 2
- 881 Holly Meadow Dr Unit 881
- 881 Holly Meadow Dr
- 881 Holly Meadow Dr Unit 2
- 879 Roxholly Ln Unit 3
- 879 Roxholly Ln NE
Your Personal Tour Guide
Ask me questions while you tour the home.