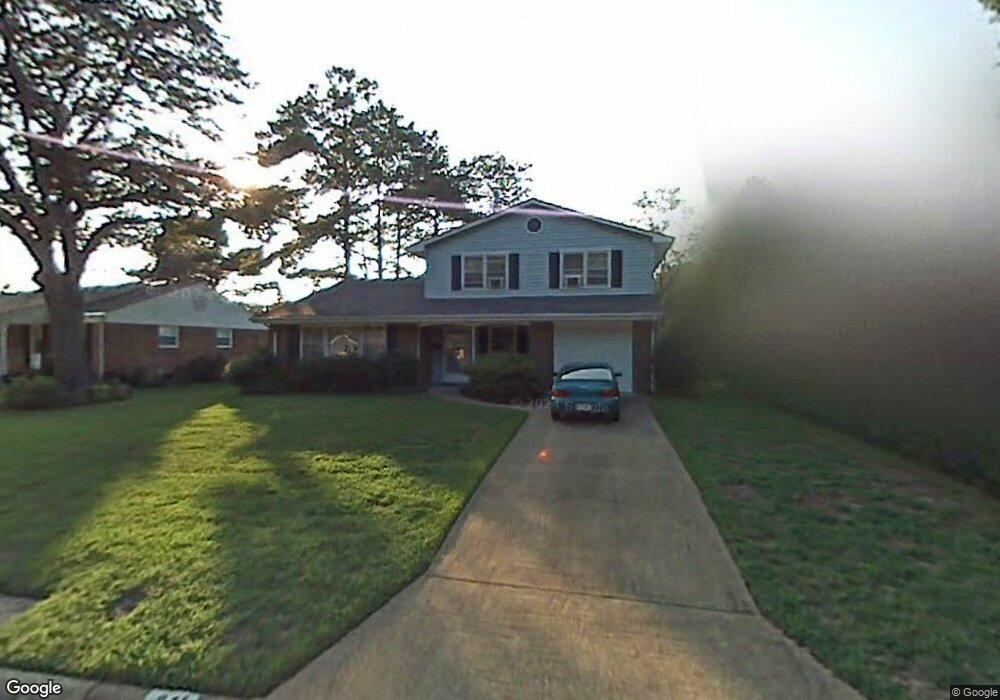
841 Morgan Trail Virginia Beach, VA 23464
Estimated Value: $406,418 - $440,000
3
Beds
3
Baths
1,829
Sq Ft
$233/Sq Ft
Est. Value
About This Home
This home is located at 841 Morgan Trail, Virginia Beach, VA 23464 and is currently estimated at $426,105, approximately $232 per square foot. 841 Morgan Trail is a home located in Virginia Beach City with nearby schools including Woodstock Elementary School, Kempsville Middle School, and Kempsville High School.
Ownership History
Date
Name
Owned For
Owner Type
Purchase Details
Closed on
Jun 9, 2017
Sold by
Sears Chad E and Sears Holly K
Bought by
Malone Charles E and Malone Arlene
Current Estimated Value
Home Financials for this Owner
Home Financials are based on the most recent Mortgage that was taken out on this home.
Original Mortgage
$270,646
Outstanding Balance
$225,183
Interest Rate
4.03%
Mortgage Type
VA
Estimated Equity
$200,922
Purchase Details
Closed on
Mar 20, 2013
Sold by
Drew Richard D
Bought by
Sears Chad E
Home Financials for this Owner
Home Financials are based on the most recent Mortgage that was taken out on this home.
Original Mortgage
$225,609
Interest Rate
3.56%
Mortgage Type
VA
Purchase Details
Closed on
Jun 3, 2012
Sold by
Williams Cynthia Hazel and Williams Curtis Myron
Bought by
Drew Richard D
Home Financials for this Owner
Home Financials are based on the most recent Mortgage that was taken out on this home.
Original Mortgage
$209,549
Interest Rate
3.75%
Mortgage Type
FHA
Create a Home Valuation Report for This Property
The Home Valuation Report is an in-depth analysis detailing your home's value as well as a comparison with similar homes in the area
Home Values in the Area
Average Home Value in this Area
Purchase History
| Date | Buyer | Sale Price | Title Company |
|---|---|---|---|
| Malone Charles E | $262,000 | Attorney | |
| Sears Chad E | $224,000 | -- | |
| Drew Richard D | $2,150,000 | -- |
Source: Public Records
Mortgage History
| Date | Status | Borrower | Loan Amount |
|---|---|---|---|
| Open | Malone Charles E | $270,646 | |
| Previous Owner | Sears Chad E | $225,609 | |
| Previous Owner | Drew Richard D | $209,549 |
Source: Public Records
Tax History Compared to Growth
Tax History
| Year | Tax Paid | Tax Assessment Tax Assessment Total Assessment is a certain percentage of the fair market value that is determined by local assessors to be the total taxable value of land and additions on the property. | Land | Improvement |
|---|---|---|---|---|
| 2025 | $3,175 | $351,600 | $140,000 | $211,600 |
| 2024 | $3,175 | $327,300 | $140,000 | $187,300 |
| 2023 | $3,238 | $327,100 | $138,000 | $189,100 |
| 2022 | $2,965 | $299,500 | $120,000 | $179,500 |
| 2021 | $2,593 | $261,900 | $88,800 | $173,100 |
| 2020 | $2,670 | $262,400 | $88,800 | $173,600 |
| 2019 | $2,654 | $253,100 | $85,000 | $168,100 |
| 2018 | $2,537 | $253,100 | $85,000 | $168,100 |
| 2017 | $2,284 | $227,800 | $85,000 | $142,800 |
| 2016 | $2,142 | $216,400 | $85,000 | $131,400 |
| 2015 | $2,120 | $214,100 | $85,000 | $129,100 |
| 2014 | $1,942 | $214,300 | $92,500 | $121,800 |
Source: Public Records
Map
Nearby Homes
- 928 Redwood Cir
- 940 Westerly Trail
- 952 Redwood Cir
- 5833 Sherman Ct
- 969 Sunnyside Dr
- 808 Raymond Ct
- 5825 Sherman Ct
- 5805 Sherman Ct
- 5829 Sherman Ct
- 5821 Sherman Ct
- 5817 Sherman Ct
- 5809 Sherman Ct
- 738 Driskill Ct
- 1001 Commonwealth Place
- 1017 Sunnyside Dr
- 1031 Commonwealth Place
- 1027 Bryce Ln
- 1066 Commonwealth Place
- 1031 Bryce Ln
- 568 Sterling Rd
- 845 Morgan Trail
- 837 Morgan Trail
- 916 Redwood Cir
- 849 Morgan Trail
- 833 Morgan Trail
- 912 Redwood Cir
- 920 Redwood Cir
- 844 Morgan Trail
- 848 Morgan Trail
- 840 Morgan Trail
- 853 Morgan Trail
- 829 Morgan Trail
- 908 Redwood Cir
- 836 Morgan Trail
- 924 Redwood Cir
- 852 Morgan Trail
- 832 Morgan Trail
- 913 Redwood Cir
- 857 Morgan Trail
- 825 Morgan Trail