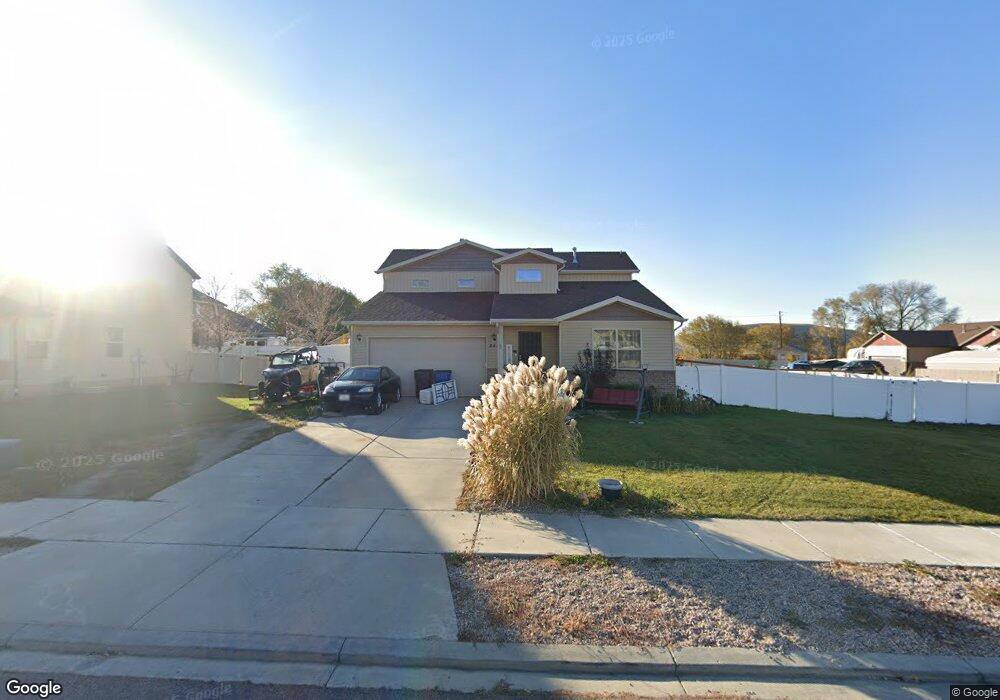
841 N 420 W Santaquin, UT 84655
Estimated Value: $513,000 - $565,000
6
Beds
3
Baths
2,982
Sq Ft
$178/Sq Ft
Est. Value
About This Home
This home is located at 841 N 420 W, Santaquin, UT 84655 and is currently estimated at $531,852, approximately $178 per square foot. 841 N 420 W is a home located in Utah County with nearby schools including Apple Valley Elementary, Payson Junior High School, and Payson High School.
Ownership History
Date
Name
Owned For
Owner Type
Purchase Details
Closed on
Aug 8, 2019
Sold by
Andrino Deniss Ee and Andrino Tanya
Bought by
Page Robert Demin
Current Estimated Value
Home Financials for this Owner
Home Financials are based on the most recent Mortgage that was taken out on this home.
Original Mortgage
$266,000
Outstanding Balance
$233,110
Interest Rate
3.73%
Mortgage Type
New Conventional
Estimated Equity
$298,742
Purchase Details
Closed on
Jun 22, 2016
Sold by
Andrino Deniss E
Bought by
Andrino Deniss E and Andrino Taanya
Home Financials for this Owner
Home Financials are based on the most recent Mortgage that was taken out on this home.
Original Mortgage
$246,683
Interest Rate
3.64%
Mortgage Type
New Conventional
Purchase Details
Closed on
Jun 21, 2016
Sold by
Gudmundson Eric J
Bought by
Andrino Deniss E
Home Financials for this Owner
Home Financials are based on the most recent Mortgage that was taken out on this home.
Original Mortgage
$246,683
Interest Rate
3.64%
Mortgage Type
New Conventional
Purchase Details
Closed on
Jun 26, 2013
Sold by
Sierra Homes Construction Inc
Bought by
Gudmundson Eric J
Home Financials for this Owner
Home Financials are based on the most recent Mortgage that was taken out on this home.
Original Mortgage
$198,671
Interest Rate
3.48%
Mortgage Type
New Conventional
Purchase Details
Closed on
Mar 12, 2013
Sold by
Apple Cove Group Llc
Bought by
Sierra Homes Construction Inc
Home Financials for this Owner
Home Financials are based on the most recent Mortgage that was taken out on this home.
Original Mortgage
$124,000
Interest Rate
3.53%
Mortgage Type
Purchase Money Mortgage
Purchase Details
Closed on
Aug 25, 2011
Sold by
Re Investments Llc
Bought by
Apple Cove Group Llc
Home Financials for this Owner
Home Financials are based on the most recent Mortgage that was taken out on this home.
Original Mortgage
$190,000
Interest Rate
4.48%
Mortgage Type
Future Advance Clause Open End Mortgage
Purchase Details
Closed on
Apr 25, 2011
Sold by
Federal Deposit Insurance Corporation
Bought by
Re Investments Llc
Create a Home Valuation Report for This Property
The Home Valuation Report is an in-depth analysis detailing your home's value as well as a comparison with similar homes in the area
Home Values in the Area
Average Home Value in this Area
Purchase History
| Date | Buyer | Sale Price | Title Company |
|---|---|---|---|
| Page Robert Demin | -- | Gt Title Services | |
| Andrino Deniss E | -- | Wasatch Land & Title | |
| Andrino Deniss E | -- | Inwest Title | |
| Gudmundson Eric J | -- | American Secure Title | |
| Sierra Homes Construction Inc | -- | American Secure Title Trem | |
| Apple Cove Group Llc | -- | Select Title Insurance Agenc | |
| Re Investments Llc | -- | First American Ncs South Te |
Source: Public Records
Mortgage History
| Date | Status | Borrower | Loan Amount |
|---|---|---|---|
| Open | Page Robert Demin | $266,000 | |
| Previous Owner | Andrino Deniss E | $246,683 | |
| Previous Owner | Andrino Deniss E | $246,683 | |
| Previous Owner | Gudmundson Eric J | $198,671 | |
| Previous Owner | Sierra Homes Construction Inc | $124,000 | |
| Previous Owner | Apple Cove Group Llc | $190,000 | |
| Previous Owner | Apple Cove Group Llc | $120,000 |
Source: Public Records
Tax History Compared to Growth
Tax History
| Year | Tax Paid | Tax Assessment Tax Assessment Total Assessment is a certain percentage of the fair market value that is determined by local assessors to be the total taxable value of land and additions on the property. | Land | Improvement |
|---|---|---|---|---|
| 2025 | $2,231 | $255,365 | $147,300 | $317,000 |
| 2024 | $2,231 | $222,145 | $0 | $0 |
| 2023 | $2,311 | $230,835 | $0 | $0 |
| 2022 | $2,351 | $242,275 | $0 | $0 |
| 2021 | $2,012 | $321,400 | $83,000 | $238,400 |
| 2020 | $1,933 | $299,200 | $72,200 | $227,000 |
| 2019 | $1,741 | $275,600 | $72,200 | $203,400 |
| 2018 | $1,662 | $250,800 | $63,100 | $187,700 |
| 2017 | $1,591 | $128,315 | $0 | $0 |
| 2016 | $1,485 | $117,370 | $0 | $0 |
| 2015 | $1,468 | $113,795 | $0 | $0 |
| 2014 | $1,442 | $111,485 | $0 | $0 |
Source: Public Records
Map
Nearby Homes
- 358 W 910 N
- 931 N 215 W
- 951 N 215 W
- 949 N 215 W
- 947 N 215 W
- 953 N 215 W
- McIntosh Plan at The Orchards
- Honey Plan at The Orchards
- Cranford Plan at The Orchards
- Monroe Plan at The Orchards
- Benson Plan at The Orchards
- Gala Plan at The Orchards
- 162 W 690 N
- 109 W 930 N
- 894 N Apple Seed Ln
- 41 W 770 N
- 1032 N Apple Seed Ln
- 369 N 500 W Unit 3
- 600 N Center St
- 116 E 840 N