Estimated Value: $208,000 - $301,000
2
Beds
6
Baths
1,047
Sq Ft
$241/Sq Ft
Est. Value
About This Home
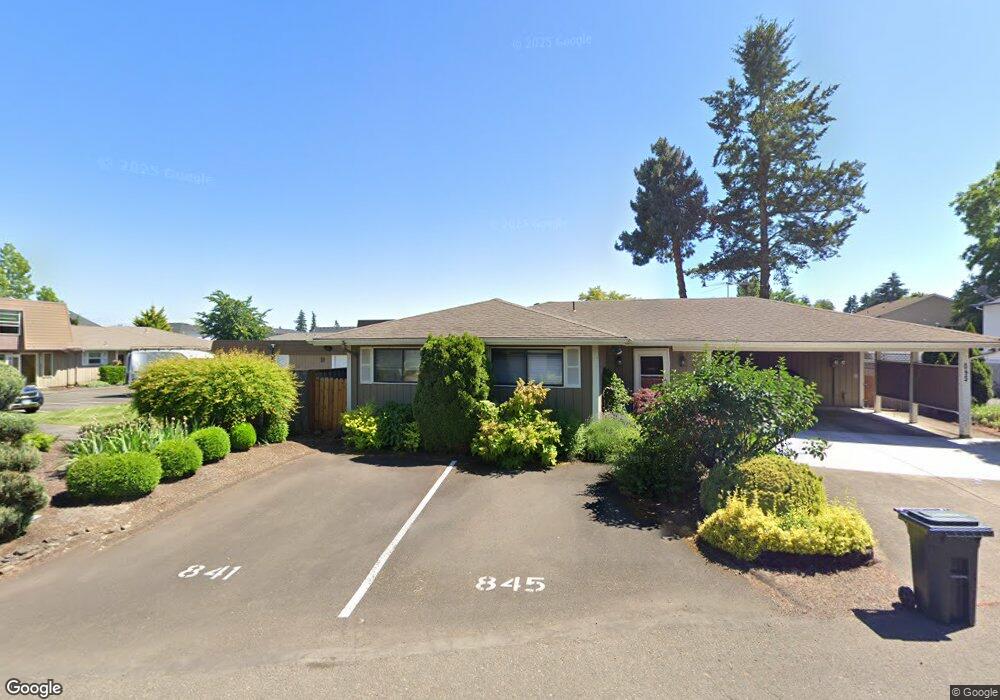
This home is located at 841 NE Territorial Rd, Canby, OR 97013 and is currently estimated at $252,498, approximately $241 per square foot. 841 NE Territorial Rd is a home located in Clackamas County with nearby schools including Josefa L. Sambrano Elementary School, William Knight Elementary School, and Baker Prairie Middle School.
Ownership History
Date
Name
Owned For
Owner Type
Purchase Details
Closed on
Oct 7, 2024
Sold by
Ulloa Carol
Bought by
Carol L Ulloa Trust and Ulloa
Current Estimated Value
Purchase Details
Closed on
Mar 22, 2005
Sold by
Viter Jon V and Viter Nicole R
Bought by
Ulloa Carol
Home Financials for this Owner
Home Financials are based on the most recent Mortgage that was taken out on this home.
Original Mortgage
$110,871
Interest Rate
5.53%
Mortgage Type
Commercial
Purchase Details
Closed on
Apr 11, 2001
Sold by
Federal National Mortgage Association
Bought by
Viter Jon V and Viter Nicole R
Home Financials for this Owner
Home Financials are based on the most recent Mortgage that was taken out on this home.
Original Mortgage
$82,450
Interest Rate
7.09%
Mortgage Type
FHA
Purchase Details
Closed on
Apr 22, 1998
Sold by
Trademark Development Llc
Bought by
Ruschenberg Robert E
Home Financials for this Owner
Home Financials are based on the most recent Mortgage that was taken out on this home.
Original Mortgage
$85,900
Interest Rate
7.15%
Mortgage Type
Commercial
Create a Home Valuation Report for This Property
The Home Valuation Report is an in-depth analysis detailing your home's value as well as a comparison with similar homes in the area
Home Values in the Area
Average Home Value in this Area
Purchase History
| Date | Buyer | Sale Price | Title Company |
|---|---|---|---|
| Carol L Ulloa Trust | -- | None Listed On Document | |
| Ulloa Carol | $114,300 | First American | |
| Viter Jon V | $85,000 | -- | |
| Ruschenberg Robert E | $90,450 | Transnation Title Insurance |
Source: Public Records
Mortgage History
| Date | Status | Borrower | Loan Amount |
|---|---|---|---|
| Previous Owner | Ulloa Carol | $110,871 | |
| Previous Owner | Viter Jon V | $82,450 | |
| Previous Owner | Ruschenberg Robert E | $85,900 |
Source: Public Records
Tax History Compared to Growth
Tax History
| Year | Tax Paid | Tax Assessment Tax Assessment Total Assessment is a certain percentage of the fair market value that is determined by local assessors to be the total taxable value of land and additions on the property. | Land | Improvement |
|---|---|---|---|---|
| 2025 | $2,529 | $142,769 | -- | -- |
| 2024 | $2,459 | $138,611 | -- | -- |
| 2023 | $2,459 | $134,574 | $0 | $0 |
| 2022 | $2,261 | $130,655 | $0 | $0 |
| 2021 | $2,178 | $126,850 | $0 | $0 |
| 2020 | $2,139 | $123,156 | $0 | $0 |
| 2019 | $2,036 | $119,569 | $0 | $0 |
| 2018 | $1,991 | $116,086 | $0 | $0 |
| 2017 | $1,941 | $112,705 | $0 | $0 |
| 2016 | $1,876 | $109,422 | $0 | $0 |
| 2015 | $1,811 | $106,235 | $0 | $0 |
| 2014 | $1,759 | $103,141 | $0 | $0 |
Source: Public Records
Map
Nearby Homes
- 832 NE 17th Ave
- 838 NE 17th Ave
- 844 NE 17th Ave
- 853 NE 17th Ave
- 1750 N Oak St
- 878 NE 17th Ave
- 952 NE 17th Ave
- 947 NE 17th Ave
- 1009 NE 17th Ave
- 660 NE 20th Ave
- 1200 NE Territorial Rd Unit 93
- 860 NE 14th Ave
- 1751 N Laurelwood Loop
- 2152 N Laurelwood St
- 312 NE 14th Ave
- 1422 NE 18th Place
- 1552 NE 19th Loop
- 187 NE 14th Ave
- 1721 N Hyssop St
- 1620 N Sweetgum St
- 845 NE Territorial Rd
- 735 NE Territorial Rd
- 853 NE Territorial Rd
- 887 NE Territorial Rd
- 883 NE Territorial Rd
- 891 NE Territorial Rd
- 861 NE Territorial Rd
- 879 NE Territorial Rd
- 863 NE Territorial Rd Unit 863
- 795 NE Territorial Rd
- 867 NE Territorial Rd
- 850 NE Territorial Rd
- 820 NE Territorial Rd
- 875 NE Territorial Rd
- 882 NE Territorial Rd
- 800 NE Territorial Rd
- 725 NE Territorial Rd
- 836 NE 17th Ave Unit L 40
- 1811 N Oak St
- 825 NE Fairway Ln