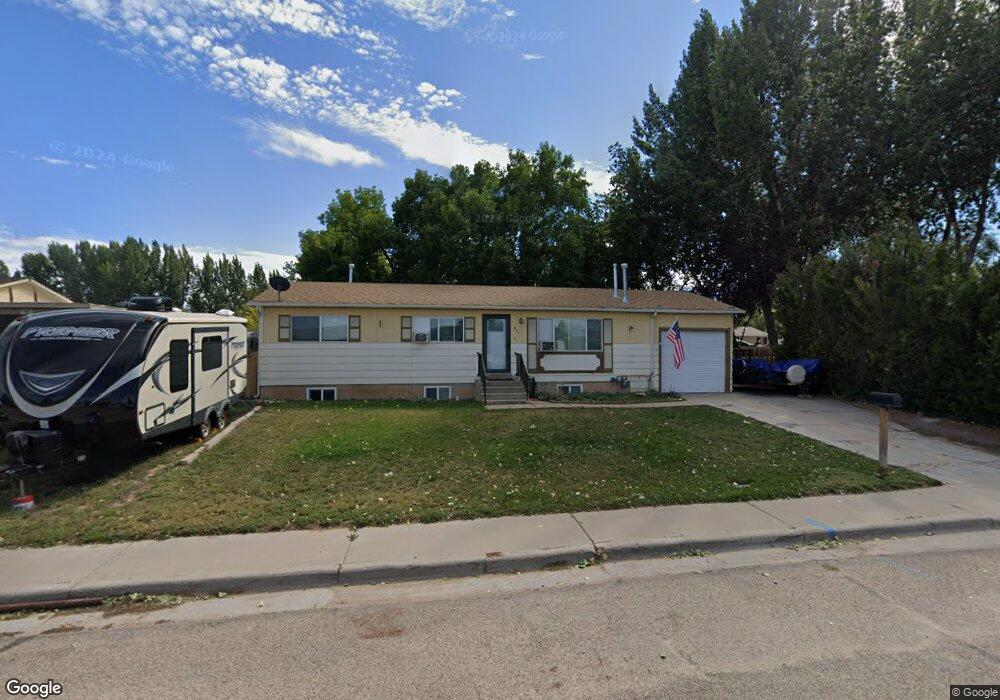
841 W 300 S Vernal, UT 84078
Estimated Value: $310,000 - $322,639
4
Beds
2
Baths
2,113
Sq Ft
$150/Sq Ft
Est. Value
About This Home
This home is located at 841 W 300 S, Vernal, UT 84078 and is currently estimated at $317,910, approximately $150 per square foot. 841 W 300 S is a home located in Uintah County with nearby schools including Discovery School, Vernal Middle School, and Uintah Middle School.
Ownership History
Date
Name
Owned For
Owner Type
Purchase Details
Closed on
Jan 24, 2012
Sold by
Jpmorgan Chase Bank Na
Bought by
Secretary Of Hud
Current Estimated Value
Purchase Details
Closed on
Apr 24, 2008
Sold by
Sharp Jeff
Bought by
Sharp Jeff and Sharp Kimberley A
Home Financials for this Owner
Home Financials are based on the most recent Mortgage that was taken out on this home.
Original Mortgage
$187,064
Interest Rate
6.11%
Mortgage Type
FHA
Create a Home Valuation Report for This Property
The Home Valuation Report is an in-depth analysis detailing your home's value as well as a comparison with similar homes in the area
Home Values in the Area
Average Home Value in this Area
Purchase History
| Date | Buyer | Sale Price | Title Company |
|---|---|---|---|
| Secretary Of Hud | -- | None Available | |
| Sharp Jeff | -- | -- | |
| Sharp Jeff | -- | -- |
Source: Public Records
Mortgage History
| Date | Status | Borrower | Loan Amount |
|---|---|---|---|
| Previous Owner | Sharp Jeff | $187,064 |
Source: Public Records
Tax History Compared to Growth
Tax History
| Year | Tax Paid | Tax Assessment Tax Assessment Total Assessment is a certain percentage of the fair market value that is determined by local assessors to be the total taxable value of land and additions on the property. | Land | Improvement |
|---|---|---|---|---|
| 2024 | $1,284 | $145,769 | $17,938 | $127,831 |
| 2023 | $1,284 | $118,974 | $17,458 | $101,516 |
| 2022 | $1,066 | $98,670 | $17,458 | $81,212 |
| 2021 | $1,092 | $45,916 | $9,602 | $36,314 |
| 2020 | $1,046 | $82,190 | $17,458 | $64,732 |
| 2019 | $1,005 | $77,976 | $19,250 | $58,726 |
| 2018 | $970 | $75,180 | $19,250 | $55,930 |
| 2017 | $10 | $77,930 | $22,000 | $55,930 |
| 2016 | $1,008 | $86,066 | $22,000 | $64,066 |
| 2015 | $968 | $89,438 | $22,000 | $67,438 |
| 2014 | $921 | $86,226 | $22,000 | $64,226 |
| 2013 | $877 | $80,387 | $22,000 | $58,387 |
Source: Public Records
Map
Nearby Homes