8410 Cox Kolbe Rd Glouster, OH 45732
Estimated Value: $263,000 - $319,000
3
Beds
2
Baths
1,792
Sq Ft
$168/Sq Ft
Est. Value
About This Home
This home is located at 8410 Cox Kolbe Rd, Glouster, OH 45732 and is currently estimated at $301,708, approximately $168 per square foot. 8410 Cox Kolbe Rd is a home located in Morgan County with nearby schools including Morgan High School.
Ownership History
Date
Name
Owned For
Owner Type
Purchase Details
Closed on
Jun 9, 2025
Sold by
Hixson Jason M and Hixson Teresa L
Bought by
Slack Tyler S and Slack Kelsi M
Current Estimated Value
Home Financials for this Owner
Home Financials are based on the most recent Mortgage that was taken out on this home.
Original Mortgage
$304,486
Outstanding Balance
$303,697
Interest Rate
6.76%
Mortgage Type
FHA
Estimated Equity
-$1,989
Purchase Details
Closed on
Mar 24, 2023
Sold by
Nicholson Deborah
Bought by
Hixson Jason M and Hixson Teresa L
Home Financials for this Owner
Home Financials are based on the most recent Mortgage that was taken out on this home.
Original Mortgage
$80,000
Interest Rate
5.76%
Mortgage Type
New Conventional
Purchase Details
Closed on
May 15, 2006
Bought by
Nicholson Deborah Tod-Brandy M Cass
Create a Home Valuation Report for This Property
The Home Valuation Report is an in-depth analysis detailing your home's value as well as a comparison with similar homes in the area
Home Values in the Area
Average Home Value in this Area
Purchase History
| Date | Buyer | Sale Price | Title Company |
|---|---|---|---|
| Slack Tyler S | $315,000 | None Listed On Document | |
| Slack Tyler S | $315,000 | None Listed On Document | |
| Hixson Jason M | $90,000 | None Listed On Document | |
| Hixson Jason M | $90,000 | None Listed On Document | |
| Nicholson Deborah Tod-Brandy M Cass | -- | -- |
Source: Public Records
Mortgage History
| Date | Status | Borrower | Loan Amount |
|---|---|---|---|
| Open | Slack Tyler S | $304,486 | |
| Closed | Slack Tyler S | $304,486 | |
| Previous Owner | Hixson Jason M | $80,000 |
Source: Public Records
Tax History Compared to Growth
Tax History
| Year | Tax Paid | Tax Assessment Tax Assessment Total Assessment is a certain percentage of the fair market value that is determined by local assessors to be the total taxable value of land and additions on the property. | Land | Improvement |
|---|---|---|---|---|
| 2024 | $1,567 | $48,690 | $9,430 | $39,260 |
| 2023 | $1,567 | $34,170 | $7,330 | $26,840 |
| 2022 | $791 | $34,170 | $7,330 | $26,840 |
| 2021 | $1,073 | $34,170 | $7,330 | $26,840 |
| 2019 | $1,067 | $32,560 | $6,980 | $25,580 |
| 2018 | $1,025 | $32,560 | $6,980 | $25,580 |
| 2017 | $894 | $27,818 | $5,285 | $22,533 |
| 2016 | $897 | $27,818 | $5,285 | $22,533 |
| 2015 | $1,990 | $27,818 | $5,285 | $22,533 |
| 2014 | $947 | $27,818 | $5,285 | $22,533 |
| 2013 | $93,072 | $27,818 | $5,285 | $22,533 |
Source: Public Records
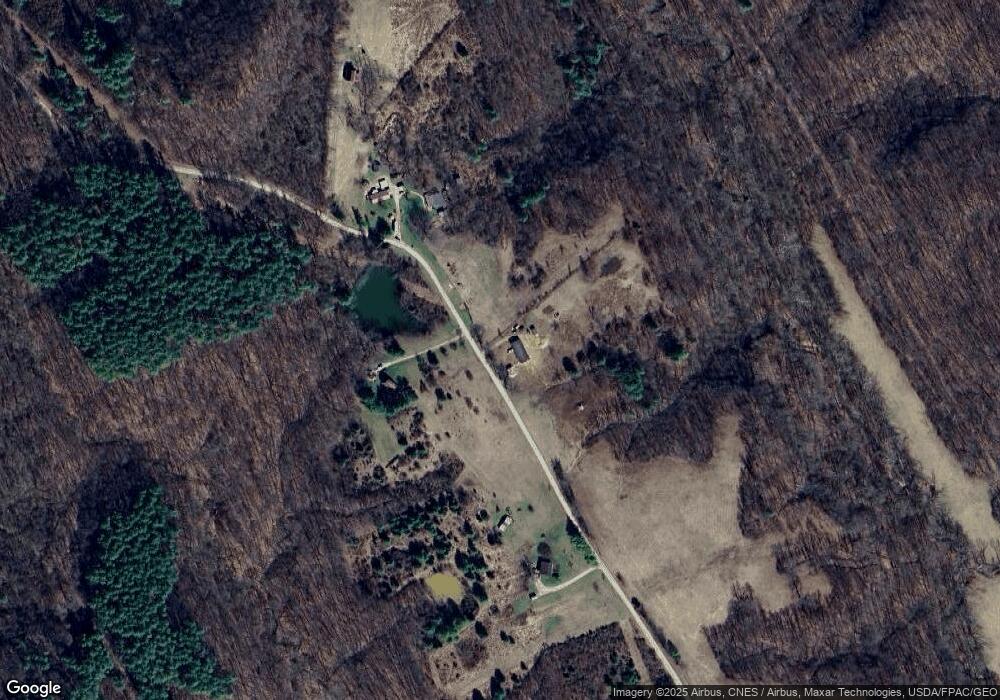
Map
Nearby Homes
- Lambert Rd
- 14500 Wolfe Rd
- 11789 Congress Run Rd
- 10219 Paulette Dr
- 0 Loudermilk Rd
- 11829 Red Rock Rd
- 19500 Lake Dr
- 18261 Jacksonville Rd
- 88 Front St
- 93 Main St
- 0 Red Rock Rd
- 23 Madison St
- 29 Barbour St
- 16222 Hooper Ridge Rd
- 33 S High St
- 18242 Ohio 13
- 15750 Bryson Rd
- 31 Locust St
- 140 Sycamore St
- 145 Sycamore St
- 8525 Cox Kolbe Rd
- 8405 Cox Kolbe Rd
- 8275 Cox Kolbe Rd
- 8680 Cox Kolbe Rd
- 8081 Cox Kolbe Rd
- 10540 Ohio 329
- 10531 State Route 329
- 0 Taylor Rd Unit 4017121
- 0 Ohio 329
- 10697 State Route 329
- 8820 Cox Kolbe Rd
- 10697 Ohio 329
- 9160 State Route 329
- 9270 Taylor Rd
- 9215 Taylor Rd
- 9500 Taylor Rd
- 0 Wrightstown Rd
- 11234 State Route 329