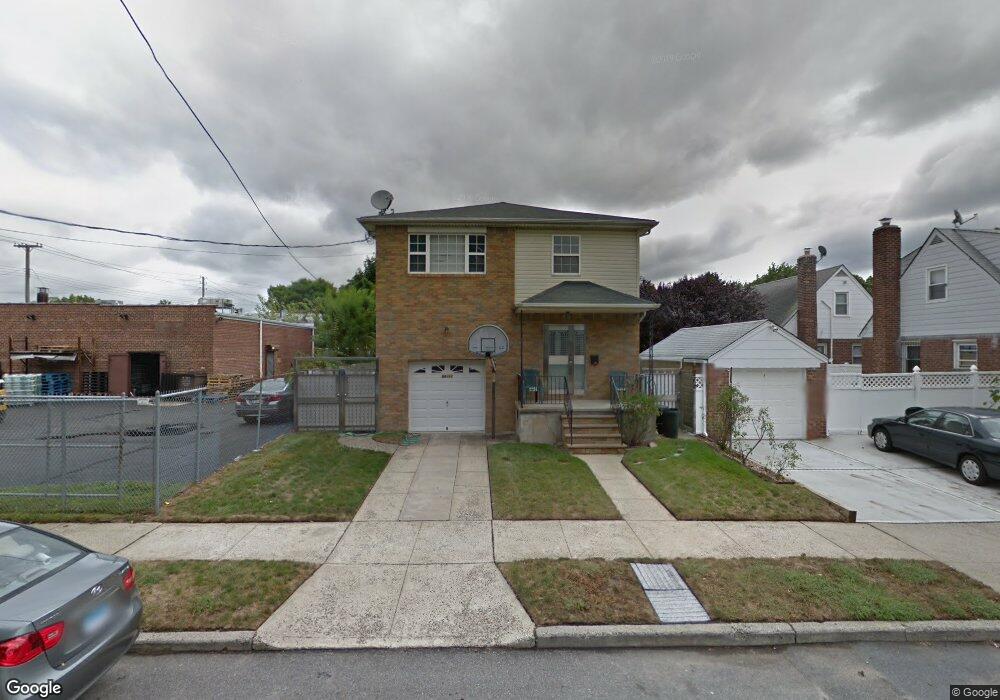
8411 265th St Floral Park, NY 11001
Estimated Value: $1,423,000 - $1,505,733
--
Bed
--
Bath
2,704
Sq Ft
$541/Sq Ft
Est. Value
About This Home
This home is located at 8411 265th St, Floral Park, NY 11001 and is currently estimated at $1,464,183, approximately $541 per square foot. 8411 265th St is a home located in Queens County with nearby schools including P.S. 191 Mayflower School, Fremont/Hay Elementary School, and Irwin Altman Middle School 172.
Ownership History
Date
Name
Owned For
Owner Type
Purchase Details
Closed on
Jan 18, 2022
Sold by
Patel Jyoti and Patel Nilkamal
Bought by
Pre 8411 Llc
Current Estimated Value
Home Financials for this Owner
Home Financials are based on the most recent Mortgage that was taken out on this home.
Original Mortgage
$665,000
Outstanding Balance
$615,557
Interest Rate
3.45%
Mortgage Type
Purchase Money Mortgage
Estimated Equity
$848,626
Purchase Details
Closed on
Jan 29, 2020
Sold by
Pre265 Inc
Bought by
Patel Jyoti and Patel Nilkamal
Purchase Details
Closed on
Apr 30, 2018
Sold by
Patel Jyoti and Patel Nilkamal
Bought by
Pre265 Inc
Purchase Details
Closed on
Apr 14, 1995
Sold by
Janna Custom Homes Inc
Bought by
Patel Nilkamal and Patel Jyoti
Home Financials for this Owner
Home Financials are based on the most recent Mortgage that was taken out on this home.
Original Mortgage
$195,000
Interest Rate
7.5%
Create a Home Valuation Report for This Property
The Home Valuation Report is an in-depth analysis detailing your home's value as well as a comparison with similar homes in the area
Home Values in the Area
Average Home Value in this Area
Purchase History
| Date | Buyer | Sale Price | Title Company |
|---|---|---|---|
| Pre 8411 Llc | -- | -- | |
| Patel Jyoti | -- | -- | |
| Pre265 Inc | -- | -- | |
| Patel Nilkamal | $271,000 | Commonwealth Land Title Ins |
Source: Public Records
Mortgage History
| Date | Status | Borrower | Loan Amount |
|---|---|---|---|
| Open | Pre 8411 Llc | $665,000 | |
| Previous Owner | Patel Nilkamal | $195,000 |
Source: Public Records
Tax History Compared to Growth
Tax History
| Year | Tax Paid | Tax Assessment Tax Assessment Total Assessment is a certain percentage of the fair market value that is determined by local assessors to be the total taxable value of land and additions on the property. | Land | Improvement |
|---|---|---|---|---|
| 2025 | $11,795 | $62,245 | $18,047 | $44,198 |
| 2024 | $11,795 | $58,723 | $19,590 | $39,133 |
| 2023 | $11,795 | $58,723 | $18,150 | $40,573 |
| 2022 | $11,367 | $76,320 | $24,720 | $51,600 |
| 2021 | $11,571 | $63,240 | $24,720 | $38,520 |
| 2020 | $10,980 | $59,280 | $24,720 | $34,560 |
| 2019 | $10,237 | $50,760 | $24,720 | $26,040 |
| 2018 | $9,976 | $48,936 | $24,320 | $24,616 |
| 2017 | $9,672 | $47,448 | $23,927 | $23,521 |
| 2016 | $8,850 | $47,448 | $23,927 | $23,521 |
| 2015 | $5,179 | $43,226 | $22,600 | $20,626 |
| 2014 | $5,179 | $40,780 | $24,511 | $16,269 |
Source: Public Records
Map
Nearby Homes
- 84-05 266th St
- 84-03 266th St
- 293 85th Ave
- 8418 263rd St
- 83-14 266th St
- 83-36 268th St
- 85-23 264th St
- 119 Emerson Ave
- 261-16 E Williston Ave
- 8343 261st St
- 82-65 268th St Unit 2nd Floor
- 8303 261st St
- 82-25 268th St Unit 175B
- 8224 Langdale St Unit 138B
- 96 Holland Ave
- 86-16 262nd St
- 81-56 264th St
- 1683 Stewart Ave
- 268-03 82nd Ave Unit 286A
- 257 Bryant Ave
- 84-11 265th St
- 26507 E Williston Ave
- 8417 265th St
- 26515 E Williston Ave
- 26508 Hillside Ave
- 26512 Hillside Ave
- 26519 E Williston Ave
- 84-08 266th St
- 8408 266th St
- 26520 Hillside Ave
- 8412 265th St
- 8416 265th St
- 84-17 265th St
- 84-16 265th St
- 26417 E Williston Ave
- 26412 Hillside Ave
- 84-26 266th St
- 26512 E Williston Ave
- 8426 266th St
- 26516 E Williston Ave