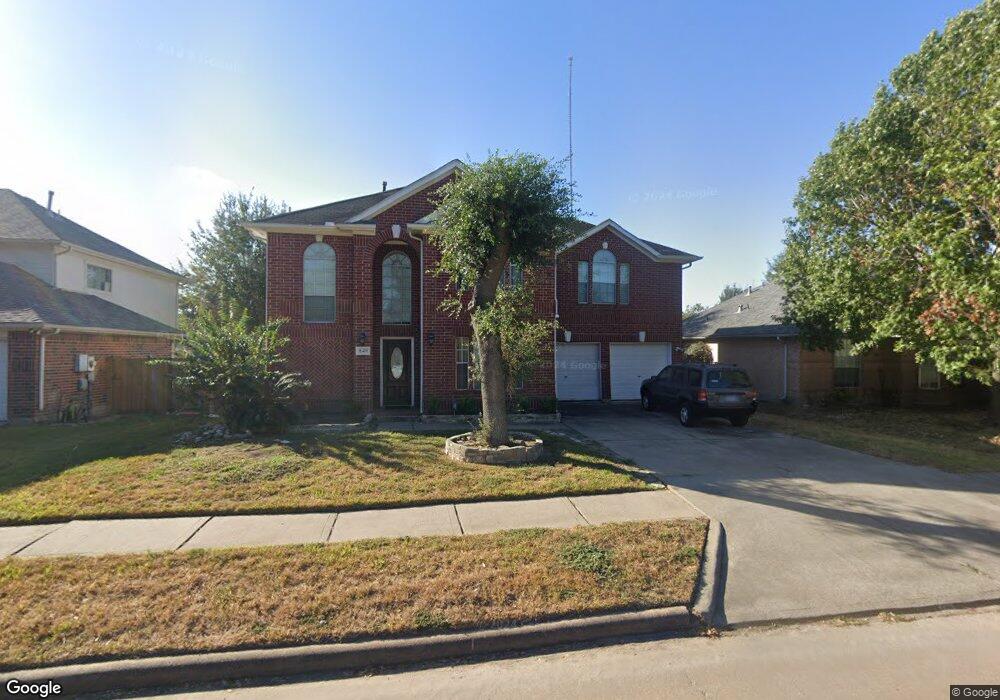
8411 Holmwood Dr Houston, TX 77040
North Houston NeighborhoodEstimated Value: $260,000 - $277,000
3
Beds
3
Baths
2,035
Sq Ft
$131/Sq Ft
Est. Value
About This Home
This home is located at 8411 Holmwood Dr, Houston, TX 77040 and is currently estimated at $267,515, approximately $131 per square foot. 8411 Holmwood Dr is a home located in Harris County with nearby schools including Reed Elementary School, Dean Middle School, and Jersey Village High School.
Ownership History
Date
Name
Owned For
Owner Type
Purchase Details
Closed on
Oct 7, 2005
Sold by
Nguyen Tommy T and Townes Lynn M
Bought by
Romero Fredy
Current Estimated Value
Home Financials for this Owner
Home Financials are based on the most recent Mortgage that was taken out on this home.
Original Mortgage
$94,800
Outstanding Balance
$55,792
Interest Rate
7.38%
Mortgage Type
Fannie Mae Freddie Mac
Estimated Equity
$211,723
Purchase Details
Closed on
Mar 27, 1998
Sold by
Trevino Susan Dianne
Bought by
Nguyen Tommy T and Townes Lynn M
Home Financials for this Owner
Home Financials are based on the most recent Mortgage that was taken out on this home.
Original Mortgage
$72,400
Interest Rate
7.04%
Purchase Details
Closed on
Aug 12, 1994
Sold by
Lennar Homes Of Texas
Bought by
Perez Richard A and Trevino Perez Susan D
Home Financials for this Owner
Home Financials are based on the most recent Mortgage that was taken out on this home.
Original Mortgage
$89,250
Interest Rate
8.66%
Create a Home Valuation Report for This Property
The Home Valuation Report is an in-depth analysis detailing your home's value as well as a comparison with similar homes in the area
Home Values in the Area
Average Home Value in this Area
Purchase History
| Date | Buyer | Sale Price | Title Company |
|---|---|---|---|
| Romero Fredy | -- | Stewart Title Houston Div | |
| Nguyen Tommy T | -- | Alamo Title Company #40 | |
| Perez Richard A | -- | Texas American Title Company |
Source: Public Records
Mortgage History
| Date | Status | Borrower | Loan Amount |
|---|---|---|---|
| Open | Romero Fredy | $94,800 | |
| Previous Owner | Nguyen Tommy T | $72,400 | |
| Previous Owner | Perez Richard A | $89,250 |
Source: Public Records
Tax History Compared to Growth
Tax History
| Year | Tax Paid | Tax Assessment Tax Assessment Total Assessment is a certain percentage of the fair market value that is determined by local assessors to be the total taxable value of land and additions on the property. | Land | Improvement |
|---|---|---|---|---|
| 2025 | $5,387 | $247,284 | $52,302 | $194,982 |
| 2024 | $5,387 | $242,176 | $47,618 | $194,558 |
| 2023 | $5,387 | $225,456 | $47,618 | $177,838 |
| 2022 | $5,765 | $241,900 | $47,618 | $194,282 |
| 2021 | $4,876 | $193,434 | $47,618 | $145,816 |
| 2020 | $4,449 | $170,395 | $34,088 | $136,307 |
| 2019 | $3,434 | $127,400 | $16,914 | $110,486 |
| 2018 | $1,835 | $127,400 | $16,914 | $110,486 |
| 2017 | $3,448 | $127,400 | $16,914 | $110,486 |
| 2016 | $3,448 | $127,400 | $16,914 | $110,486 |
| 2015 | $3,097 | $127,400 | $16,914 | $110,486 |
| 2014 | $3,097 | $113,697 | $16,914 | $96,783 |
Source: Public Records
Map
Nearby Homes
- 8403 Cienna Dr
- 7823 Redlands Dr
- 8315 Whisper Point Dr
- 8315 Terrace Brook Dr
- 7915 Corrian Park Cir
- 8202 Terrace Brook Dr
- 8115 Oahu Ct
- 7802 Percussion Place
- 8418 Westnut Ln
- 8126 Ivan Reid Dr
- 8715 Andante Dr
- 8111 Ivan Reid Dr
- 8006 Summer Trail Dr
- 8131 Debbie Gay Dr
- 7926 Westington Ln
- 10515 Ince Ln
- 7410 Wood Bluff Blvd
- 6508 Redcliff Rd
- 7714 Rolling Fork Ln
- 7918 Battleoak Dr
- 8407 Holmwood Dr
- 8415 Holmwood Dr
- 8419 Holmwood Dr
- 8403 Holmwood Dr
- 8414 Holmwood Dr
- 8410 Holmwood Dr
- 8418 Holmwood Dr
- 8406 Holmwood Dr
- 8323 Holmwood Dr
- 8422 Holmwood Dr
- 8326 Holmwood Dr
- 8415 Summertree Dr
- 8411 Summertree Dr
- 8319 Holmwood Dr
- 8423 Summertree Dr
- 8403 Summertree Dr
- 8426 Holmwood Dr
- 8322 Holmwood Dr
- 8427 Summertree Dr
- 8331 Summertree Dr