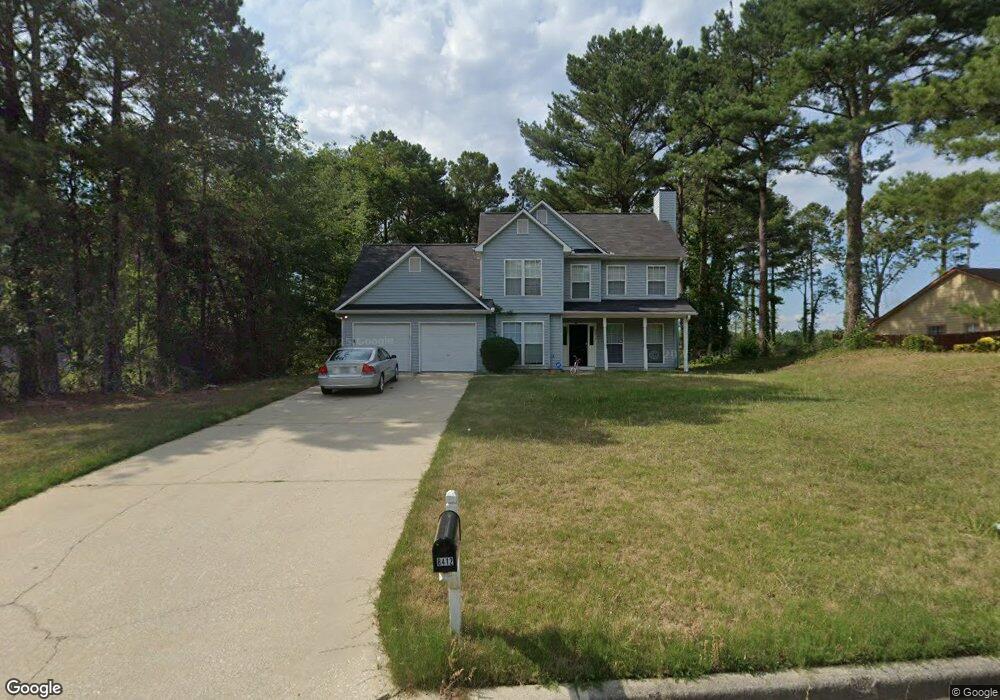
8412 Falling Rocks Way Unit 1 Lithonia, GA 30058
Estimated Value: $269,000 - $292,026
3
Beds
3
Baths
1,614
Sq Ft
$175/Sq Ft
Est. Value
About This Home
This home is located at 8412 Falling Rocks Way Unit 1, Lithonia, GA 30058 and is currently estimated at $282,007, approximately $174 per square foot. 8412 Falling Rocks Way Unit 1 is a home located in DeKalb County with nearby schools including Rock Chapel Elementary School, Lithonia Middle School, and Lithonia High School.
Ownership History
Date
Name
Owned For
Owner Type
Purchase Details
Closed on
Apr 18, 2018
Sold by
Tah 2015 1 Borrower Llc
Bought by
Tah 2018 1 Borrower Llc and C/O Tricon American Homes Llc
Current Estimated Value
Purchase Details
Closed on
May 12, 2015
Sold by
Castle Atlanta Holding Lp
Bought by
Tah 2015 1 Borrower Llc
Purchase Details
Closed on
Jan 7, 2014
Sold by
Murphy Tamera
Bought by
Castle Atlanta Holding Lp
Purchase Details
Closed on
May 25, 2006
Sold by
Harpagon Co Llc
Bought by
Murphy Tamera
Home Financials for this Owner
Home Financials are based on the most recent Mortgage that was taken out on this home.
Original Mortgage
$115,920
Interest Rate
8.07%
Mortgage Type
New Conventional
Purchase Details
Closed on
Sep 24, 2003
Sold by
Heartwood 11 Llc
Bought by
Harpagon Co Llc
Purchase Details
Closed on
Jun 5, 1996
Sold by
Harrell Peggy M
Bought by
Star Custom Homes
Purchase Details
Closed on
Feb 28, 1996
Sold by
Star Custom Homes
Bought by
Joynyer Cynthia G
Create a Home Valuation Report for This Property
The Home Valuation Report is an in-depth analysis detailing your home's value as well as a comparison with similar homes in the area
Home Values in the Area
Average Home Value in this Area
Purchase History
| Date | Buyer | Sale Price | Title Company |
|---|---|---|---|
| Tah 2018 1 Borrower Llc | -- | -- | |
| Tah 2015 1 Borrower Llc | -- | -- | |
| Castle Atlanta Holding Lp | $59,000 | -- | |
| Murphy Tamera | $144,900 | -- | |
| Harpagon Co Llc | $95,000 | -- | |
| Star Custom Homes | $15,000 | -- | |
| Joynyer Cynthia G | $116,100 | -- |
Source: Public Records
Mortgage History
| Date | Status | Borrower | Loan Amount |
|---|---|---|---|
| Previous Owner | Murphy Tamera | $115,920 |
Source: Public Records
Tax History Compared to Growth
Tax History
| Year | Tax Paid | Tax Assessment Tax Assessment Total Assessment is a certain percentage of the fair market value that is determined by local assessors to be the total taxable value of land and additions on the property. | Land | Improvement |
|---|---|---|---|---|
| 2025 | $5,296 | $111,520 | $13,040 | $98,480 |
| 2024 | $5,295 | $111,520 | $13,040 | $98,480 |
| 2023 | $5,295 | $77,640 | $13,199 | $64,441 |
| 2022 | $3,721 | $77,640 | $13,199 | $64,441 |
| 2021 | $3,721 | $77,640 | $13,040 | $64,600 |
| 2020 | $3,052 | $62,400 | $13,040 | $49,360 |
| 2019 | $2,971 | $60,560 | $13,040 | $47,520 |
| 2018 | $2,011 | $55,440 | $13,040 | $42,400 |
| 2017 | $1,428 | $25,280 | $13,146 | $12,134 |
| 2016 | $1,430 | $25,280 | $13,146 | $12,134 |
| 2014 | -- | $25,280 | $13,040 | $12,240 |
Source: Public Records
Map
Nearby Homes
- 8581 Secretariat Dr
- 8585 Secretariat Dr
- 8568 Secretariat Dr
- 8566 Secretariat Dr
- 1627 Palladian Way
- 1629 Palladian Way
- 1625 Palladian Way
- 8591 Secretariat Dr
- 8592 Secretariat Dr
- 8584 Seabiscuit Rd
- 8599 Secretariat Dr
- 8601 Secretariat Dr
- 1736 Mossy Rock Cove
- 8564 Secretariat Dr
- Hayden Plan at Champion's Run
- Penwell Plan at Champion's Run
- Macon Plan at Champion's Run
- Cali Plan at Champion's Run
- Galen Plan at Champion's Run
- 8412 Falling Rocks Way
- 8404 Falling Rocks Way
- 8422 Falling Rocks Way Unit 1
- 8394 Falling Rocks Way Unit 1
- 1720 Boulder Cove Unit 1
- 8425 Falling Rocks Way
- 8432 Falling Rocks Way Unit 3
- 1719 Boulder Cove Unit 1
- 1732 Boulder Cove Unit 1
- 1732 Boulder Cove Unit 5
- 8445 Falling Rocks Way
- 1727 Boulder Cove
- 8385 Falling Rocks Way Unit 1
- 8442 Falling Rocks Way Unit 3
- 0 Falling Rocks Way Unit 7054694
- 1740 Boulder Cove Unit 1
- 8374 Falling Rocks Way
- 8600 Secretariat Dr Unit 126
- 1739 Boulder Cove Unit 1
- 8459 Falling Rocks Way