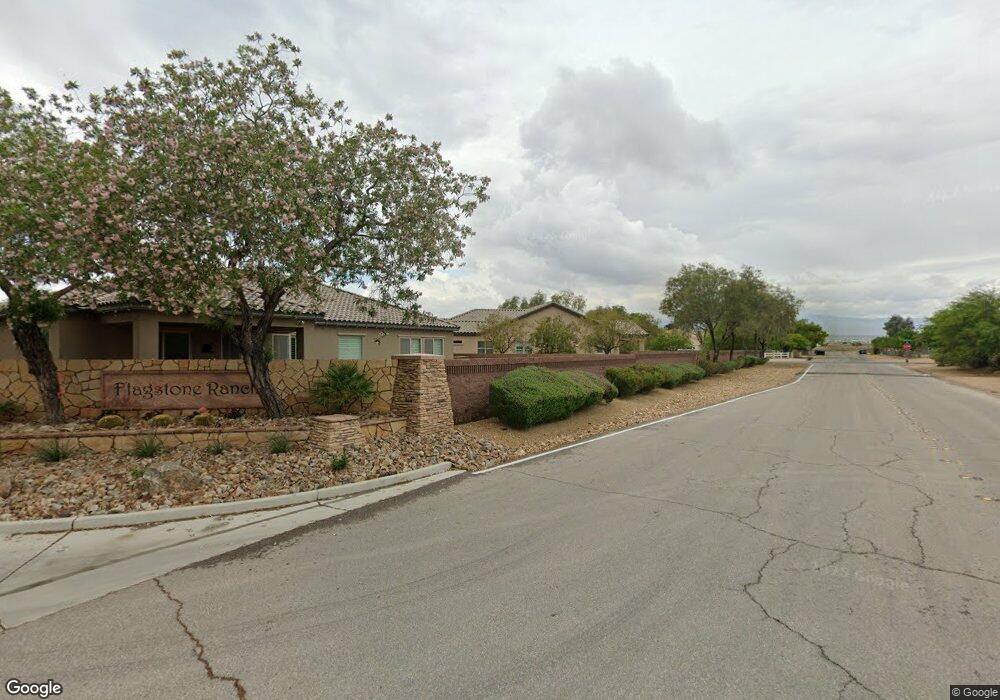
8412 Illusionary Magic Cir Las Vegas, NV 89131
Tule Springs NeighborhoodEstimated Value: $881,965 - $945,000
4
Beds
3
Baths
3,263
Sq Ft
$281/Sq Ft
Est. Value
About This Home
This home is located at 8412 Illusionary Magic Cir, Las Vegas, NV 89131 and is currently estimated at $917,991, approximately $281 per square foot. 8412 Illusionary Magic Cir is a home located in Clark County with nearby schools including Kitty Mcdonough Ward Elementary School, Anthony Saville Middle School, and Shadow Ridge High School.
Ownership History
Date
Name
Owned For
Owner Type
Purchase Details
Closed on
Dec 24, 2014
Sold by
Collins Natalie L
Bought by
Myhre Steven W
Current Estimated Value
Home Financials for this Owner
Home Financials are based on the most recent Mortgage that was taken out on this home.
Original Mortgage
$402,870
Outstanding Balance
$309,050
Interest Rate
3.96%
Mortgage Type
VA
Estimated Equity
$608,941
Purchase Details
Closed on
Oct 10, 2007
Sold by
Pn Ii Inc
Bought by
Myhre Steven W and Collins Natalie L
Home Financials for this Owner
Home Financials are based on the most recent Mortgage that was taken out on this home.
Original Mortgage
$559,250
Interest Rate
6.4%
Mortgage Type
Purchase Money Mortgage
Purchase Details
Closed on
Oct 2, 2006
Sold by
Phase Three Inc
Bought by
Pn Ii Inc and Pulte Homes Of Nevada
Purchase Details
Closed on
Jun 26, 2006
Sold by
Quarterhorse Falls Estates Llc
Bought by
Phase Three Inc
Create a Home Valuation Report for This Property
The Home Valuation Report is an in-depth analysis detailing your home's value as well as a comparison with similar homes in the area
Home Values in the Area
Average Home Value in this Area
Purchase History
| Date | Buyer | Sale Price | Title Company |
|---|---|---|---|
| Myhre Steven W | -- | Nevada Title Las Vegas | |
| Myhre Steven W | $573,890 | Lawyers Title Of Nevada | |
| Pn Ii Inc | $5,305,750 | Equity Title Of Nevada | |
| Phase Three Inc | -- | Accommodation |
Source: Public Records
Mortgage History
| Date | Status | Borrower | Loan Amount |
|---|---|---|---|
| Open | Myhre Steven W | $402,870 | |
| Previous Owner | Myhre Steven W | $559,250 |
Source: Public Records
Tax History Compared to Growth
Tax History
| Year | Tax Paid | Tax Assessment Tax Assessment Total Assessment is a certain percentage of the fair market value that is determined by local assessors to be the total taxable value of land and additions on the property. | Land | Improvement |
|---|---|---|---|---|
| 2025 | $5,212 | $257,317 | $64,750 | $192,567 |
| 2024 | $4,826 | $257,317 | $64,750 | $192,567 |
| 2023 | $4,826 | $251,699 | $71,050 | $180,649 |
| 2022 | $4,469 | $222,088 | $57,050 | $165,038 |
| 2021 | $4,138 | $188,833 | $52,500 | $136,333 |
| 2020 | $3,840 | $180,446 | $45,500 | $134,946 |
| 2019 | $3,598 | $176,168 | $42,350 | $133,818 |
| 2018 | $3,434 | $160,593 | $39,200 | $121,393 |
| 2017 | $4,541 | $166,543 | $36,400 | $130,143 |
| 2016 | $3,214 | $146,594 | $28,000 | $118,594 |
| 2015 | $3,214 | $137,672 | $21,000 | $116,672 |
| 2014 | $3,114 | $110,817 | $21,000 | $89,817 |
Source: Public Records
Map
Nearby Homes
- 6325 Guy Ave
- 5 Acres Dr
- 6383 Horse Dr
- 6120 Matisse Ave
- 8713 Long Winter Ct
- 8630 Lavender Ridge St
- 8705 Lavender Ridge St
- 6265 W Iron Mountain Rd
- 8512 Canyon Ranch St
- 5912 Kit Cove Ct
- 6695 Running Colors Ave
- 5820 Amber Station Ave
- 5808 Amber Station Ave
- 8225 Fulton Ranch St
- 6554 Fence Jumper Ave
- 6617 Golden Bit Ave
- 8228 Fulton Ranch St
- 8723 Melissa Meadows St
- 8078 Leather Harness St
- 6828 Rolling Oaks Ct
- 8418 Illusionary Magic Cir
- 8406 Illusionary Magic Cir
- 8620 Mustang St
- 8424 Illusionary Magic Cir
- 8405 Illusionary Magic Cir
- 8490 Illusionary Magic Cir
- 8489 Illusionary Magic Cir
- 8430 Illusionary Magic Cir
- 8441 Illusionary Magic Cir
- 8484 Illusionary Magic Cir
- 8478 Illusionary Magic Cir
- 8449 Illusionary Magic Cir
- 8472 Illusionary Magic Cir
- 8436 Illusionary Magic Cir
- 6320 Guy Ave
- 8442 Illusionary Magic Cir
- 8448 Illusionary Magic Cir
- 8466 Illusionary Magic Cir
- 8454 Illusionary Magic Cir
- 8581 Lava Point St