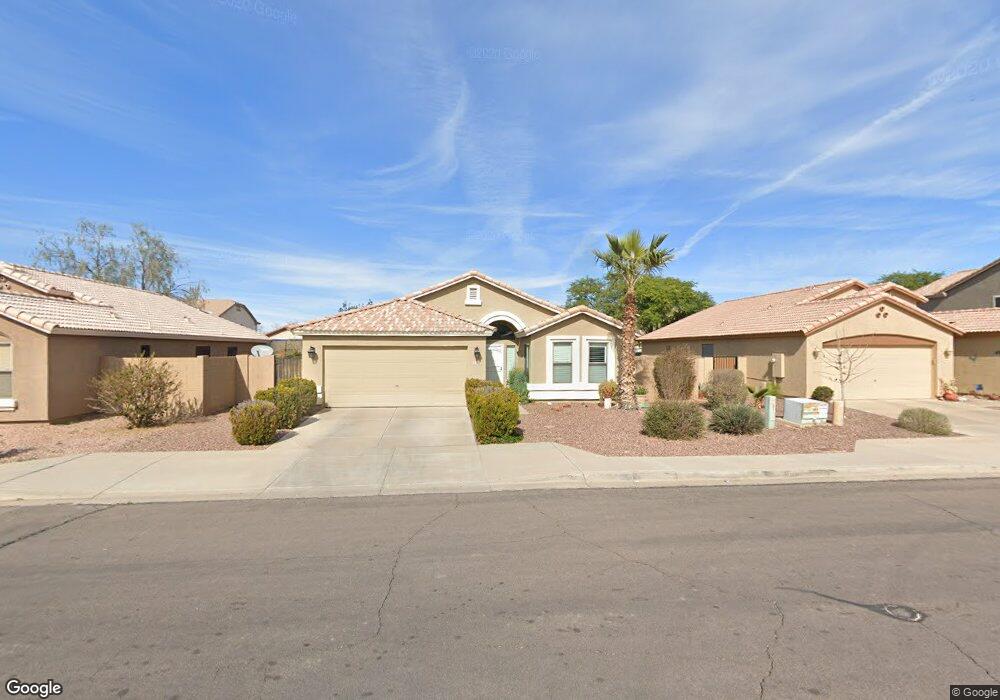
8412 W Whyman Ave Tolleson, AZ 85353
Estrella Village NeighborhoodEstimated Value: $300,794 - $351,000
--
Bed
2
Baths
1,258
Sq Ft
$264/Sq Ft
Est. Value
About This Home
This home is located at 8412 W Whyman Ave, Tolleson, AZ 85353 and is currently estimated at $331,699, approximately $263 per square foot. 8412 W Whyman Ave is a home located in Maricopa County with nearby schools including Dos Rios Elementary School, Tolleson Union High School, and Arts Academy at Estrella Mountain.
Ownership History
Date
Name
Owned For
Owner Type
Purchase Details
Closed on
Sep 16, 2022
Sold by
Murillo Frances O
Bought by
Murillo Frances O and Villalpando Christine L
Current Estimated Value
Purchase Details
Closed on
Jun 26, 2006
Sold by
Murillo Frances O
Bought by
Murillo Jesus and Murillo Frances O
Home Financials for this Owner
Home Financials are based on the most recent Mortgage that was taken out on this home.
Original Mortgage
$170,000
Interest Rate
8.52%
Mortgage Type
Balloon
Purchase Details
Closed on
Sep 20, 2002
Sold by
Richmond American Homes Of Arizona Inc
Bought by
Murillo Frances O
Home Financials for this Owner
Home Financials are based on the most recent Mortgage that was taken out on this home.
Original Mortgage
$98,800
Interest Rate
8.74%
Mortgage Type
New Conventional
Create a Home Valuation Report for This Property
The Home Valuation Report is an in-depth analysis detailing your home's value as well as a comparison with similar homes in the area
Home Values in the Area
Average Home Value in this Area
Purchase History
| Date | Buyer | Sale Price | Title Company |
|---|---|---|---|
| Murillo Frances O | -- | -- | |
| Murillo Frances O | -- | -- | |
| Murillo Jesus | -- | Netco | |
| Murillo Frances O | $123,575 | Fidelity National Title |
Source: Public Records
Mortgage History
| Date | Status | Borrower | Loan Amount |
|---|---|---|---|
| Previous Owner | Murillo Jesus | $170,000 | |
| Previous Owner | Murillo Frances O | $98,800 |
Source: Public Records
Tax History Compared to Growth
Tax History
| Year | Tax Paid | Tax Assessment Tax Assessment Total Assessment is a certain percentage of the fair market value that is determined by local assessors to be the total taxable value of land and additions on the property. | Land | Improvement |
|---|---|---|---|---|
| 2025 | $1,293 | $9,407 | -- | -- |
| 2024 | $1,131 | $8,959 | -- | -- |
| 2023 | $1,131 | $23,780 | $4,750 | $19,030 |
| 2022 | $1,101 | $17,350 | $3,470 | $13,880 |
| 2021 | $1,008 | $16,530 | $3,300 | $13,230 |
| 2020 | $1,001 | $14,830 | $2,960 | $11,870 |
| 2019 | $1,020 | $13,200 | $2,640 | $10,560 |
| 2018 | $904 | $12,120 | $2,420 | $9,700 |
| 2017 | $833 | $10,430 | $2,080 | $8,350 |
| 2016 | $822 | $9,000 | $1,800 | $7,200 |
| 2015 | $744 | $8,250 | $1,650 | $6,600 |
Source: Public Records
Map
Nearby Homes
- 2620 S 84th Glen
- 8341 W Gross Ave
- 8313 W Gross Ave
- 2202 S 82nd Ave
- 1902 S 86th Dr
- 8146 W Hilton Ave
- 8132 W Hammond Ln
- 8534 W Cordes Rd
- 8650 W Payson Rd
- 2325 S 88th Dr
- 2324 S 88th Dr
- 2010 S 80th Ln
- 8214 W Florence Ave
- 8036 W Preston Ln
- 8328 W Pioneer St
- 8121 W Lumbee St
- 3108 S 87th Dr
- 8214 W Papago St
- 1910 S 80th Ave
- 1603 S 81st Dr
- 8408 W Whyman Ave
- 8416 W Whyman Ave
- 8413 W Hilton
- 8409 W Hilton
- 8420 W Whyman Ave
- 8417 W Hilton
- 8404 W Whyman Ave
- 8405 W Hilton
- 8421 W Hilton
- 8415 W Whyman Ave
- 8411 W Whyman Ave
- 8424 W Whyman Ave
- 8401 W Hilton
- 8425 W Hilton
- 8419 W Whyman Ave
- 8407 W Whyman Ave
- 8428 W Whyman Ave
- 8423 W Whyman Ave
- 8403 W Whyman Ave
- 2403 S 84th Dr