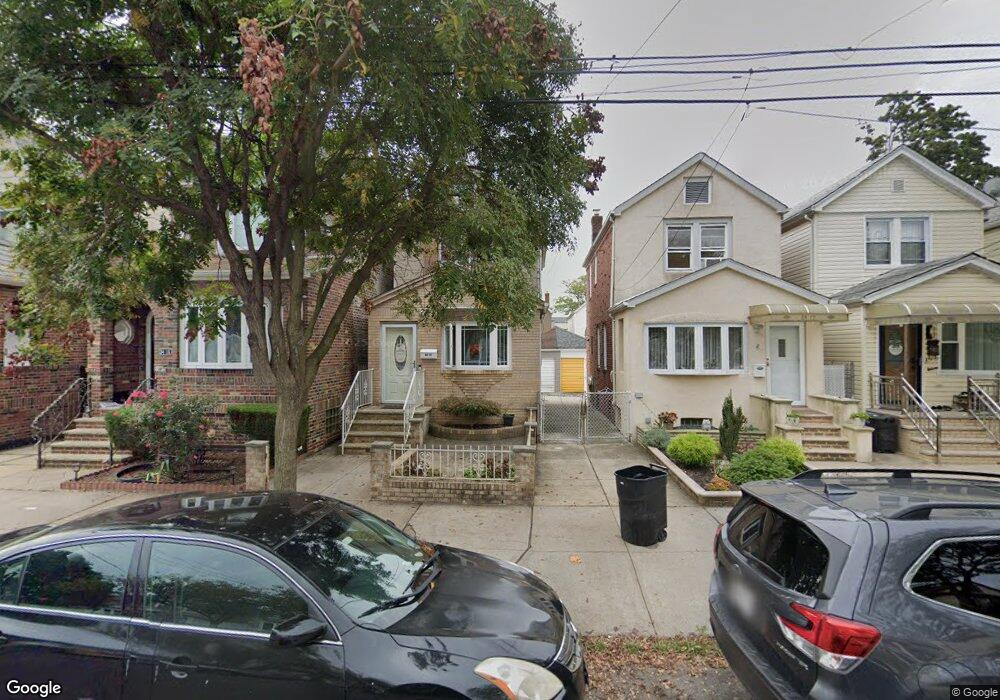
8414 107th Ave Ozone Park, NY 11417
Ozone Park NeighborhoodEstimated Value: $565,539 - $729,000
--
Bed
--
Bath
896
Sq Ft
$725/Sq Ft
Est. Value
About This Home
This home is located at 8414 107th Ave, Ozone Park, NY 11417 and is currently estimated at $649,635, approximately $725 per square foot. 8414 107th Ave is a home located in Queens County with nearby schools including P.S. 63 - Old South, Robert H. Goddard High School, and Divine Mercy Catholic Academy.
Ownership History
Date
Name
Owned For
Owner Type
Purchase Details
Closed on
Jun 6, 2007
Sold by
Samuel Ronnie
Bought by
Rosado Jenifer and Rosado Samuel Ronnie
Current Estimated Value
Purchase Details
Closed on
Feb 10, 2006
Sold by
Echeverria Edy Herrera and Herrera Neri
Bought by
Samuel Ronnie
Home Financials for this Owner
Home Financials are based on the most recent Mortgage that was taken out on this home.
Original Mortgage
$385,000
Outstanding Balance
$213,872
Interest Rate
6.17%
Mortgage Type
Purchase Money Mortgage
Estimated Equity
$435,763
Purchase Details
Closed on
Jul 1, 1999
Sold by
Catti Steven and Catti Donna
Bought by
Albertini Donald
Home Financials for this Owner
Home Financials are based on the most recent Mortgage that was taken out on this home.
Original Mortgage
$145,150
Interest Rate
7.53%
Mortgage Type
FHA
Create a Home Valuation Report for This Property
The Home Valuation Report is an in-depth analysis detailing your home's value as well as a comparison with similar homes in the area
Home Values in the Area
Average Home Value in this Area
Purchase History
| Date | Buyer | Sale Price | Title Company |
|---|---|---|---|
| Rosado Jenifer | -- | -- | |
| Rosado Jenifer | -- | -- | |
| Samuel Ronnie | $385,000 | -- | |
| Samuel Ronnie | $385,000 | -- | |
| Albertini Donald | $158,000 | -- | |
| Albertini Donald | $158,000 | -- |
Source: Public Records
Mortgage History
| Date | Status | Borrower | Loan Amount |
|---|---|---|---|
| Open | Samuel Ronnie | $385,000 | |
| Closed | Samuel Ronnie | $385,000 | |
| Previous Owner | Albertini Donald | $145,150 | |
| Closed | Rosado Jenifer | $0 |
Source: Public Records
Tax History Compared to Growth
Tax History
| Year | Tax Paid | Tax Assessment Tax Assessment Total Assessment is a certain percentage of the fair market value that is determined by local assessors to be the total taxable value of land and additions on the property. | Land | Improvement |
|---|---|---|---|---|
| 2025 | $4,318 | $22,680 | $8,679 | $14,001 |
| 2024 | $4,318 | $21,497 | $7,722 | $13,775 |
| 2023 | $4,145 | $20,635 | $6,867 | $13,768 |
| 2022 | $3,947 | $33,420 | $11,940 | $21,480 |
| 2021 | $3,981 | $31,860 | $11,940 | $19,920 |
| 2020 | $4,001 | $28,320 | $11,940 | $16,380 |
| 2019 | $3,747 | $25,380 | $11,940 | $13,440 |
| 2018 | $3,505 | $17,196 | $6,927 | $10,269 |
| 2017 | $3,359 | $16,478 | $7,644 | $8,834 |
| 2016 | $3,151 | $16,478 | $7,644 | $8,834 |
| 2015 | $1,875 | $15,750 | $9,184 | $6,566 |
| 2014 | $1,875 | $14,929 | $9,454 | $5,475 |
Source: Public Records
Map
Nearby Homes
- 84-28 108th Ave
- 84-11 Sutter Ave
- 8509 Sutter Ave
- 84-09 107th Ave
- 10724 87th St
- 105-34 86th St
- 105-35 86th St
- 132-36 84th St
- 105-21 84th St
- 105-47 88 St
- 105-43 88th St
- 105-04 87th St
- 10751 89th St
- 84-07 Sutter Ave
- 13236 82nd St
- 132-18 89th St
- 107-50 90th St
- 133-28 86th St
- 10714 80th St
- 81-56 102nd Rd
- 8412 107th Ave
- 8416 107th Ave
- 8412 107th Ave
- 8410 107th Ave
- 8418 107th Ave
- 8420 107th Ave
- 8408 107th Ave
- 8422 107th Ave
- 8406 107th Ave
- 84-06 107th Ave
- 8406 107th Ave
- 8413 108th Ave
- 8415 108th Ave
- 8411 108th Ave
- 8417 108th Ave
- 8424 107th Ave
- 8404 107th Ave
- 8409 108th Ave
- 8413 108th Ave
- 8411 108th Ave