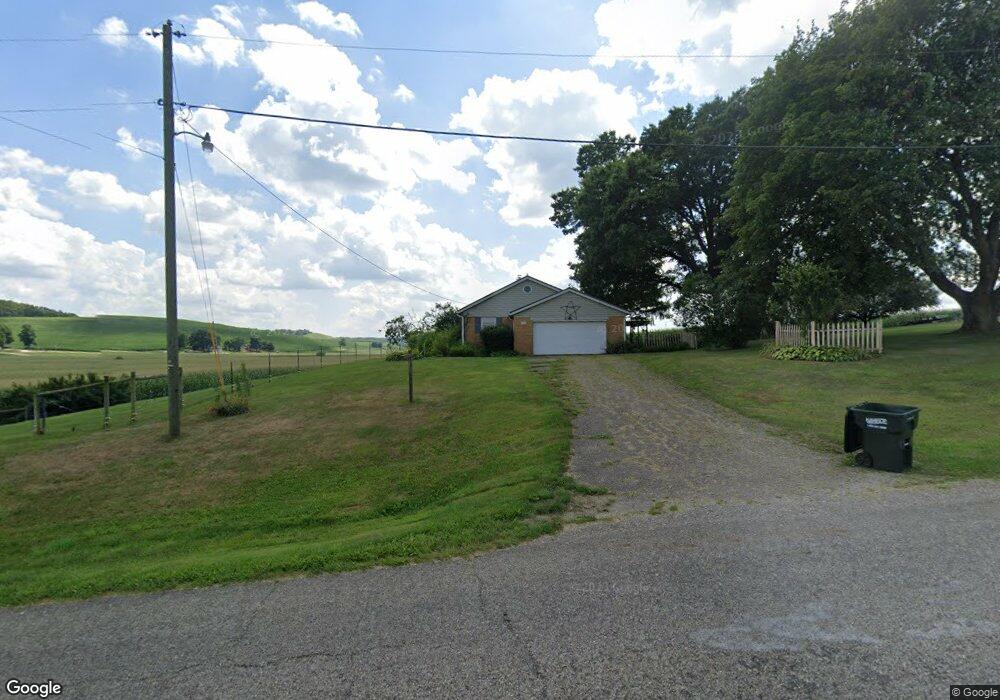
8416 Sugarcreek Rd NW Sugarcreek, OH 44681
Estimated Value: $229,000 - $312,000
3
Beds
2
Baths
1,604
Sq Ft
$163/Sq Ft
Est. Value
About This Home
This home is located at 8416 Sugarcreek Rd NW, Sugarcreek, OH 44681 and is currently estimated at $261,424, approximately $162 per square foot. 8416 Sugarcreek Rd NW is a home located in Tuscarawas County with nearby schools including Garaway High School, Sand Hill School, and Stony Point School.
Ownership History
Date
Name
Owned For
Owner Type
Purchase Details
Closed on
Aug 13, 2024
Sold by
Knotts Lorri B
Bought by
Hostetler Lydia E and Hostetler Hunter T
Current Estimated Value
Home Financials for this Owner
Home Financials are based on the most recent Mortgage that was taken out on this home.
Original Mortgage
$155,000
Outstanding Balance
$153,253
Interest Rate
6.89%
Mortgage Type
New Conventional
Estimated Equity
$108,171
Purchase Details
Closed on
Jul 18, 2003
Sold by
Knotts Gregory J
Bought by
Knotts Lorri B
Purchase Details
Closed on
Sep 28, 2001
Sold by
Herman Ruth
Bought by
Knotts Gregory J and Knotts Lorri B
Home Financials for this Owner
Home Financials are based on the most recent Mortgage that was taken out on this home.
Original Mortgage
$131,950
Interest Rate
6.97%
Mortgage Type
FHA
Purchase Details
Closed on
Apr 18, 1991
Bought by
Knotts Lorri B
Create a Home Valuation Report for This Property
The Home Valuation Report is an in-depth analysis detailing your home's value as well as a comparison with similar homes in the area
Home Values in the Area
Average Home Value in this Area
Purchase History
| Date | Buyer | Sale Price | Title Company |
|---|---|---|---|
| Hostetler Lydia E | -- | Connolly Hillyer Welch Title | |
| Knotts Lorri B | -- | -- | |
| Knotts Gregory J | $135,000 | -- | |
| Knotts Lorri B | -- | -- |
Source: Public Records
Mortgage History
| Date | Status | Borrower | Loan Amount |
|---|---|---|---|
| Open | Hostetler Lydia E | $155,000 | |
| Previous Owner | Knotts Gregory J | $131,950 |
Source: Public Records
Tax History Compared to Growth
Tax History
| Year | Tax Paid | Tax Assessment Tax Assessment Total Assessment is a certain percentage of the fair market value that is determined by local assessors to be the total taxable value of land and additions on the property. | Land | Improvement |
|---|---|---|---|---|
| 2024 | $2,436 | $64,520 | $14,920 | $49,600 |
| 2023 | $2,436 | $184,320 | $42,620 | $141,700 |
| 2022 | $2,439 | $64,512 | $14,917 | $49,595 |
| 2021 | $2,246 | $56,060 | $13,552 | $42,508 |
| 2020 | $2,253 | $56,060 | $13,552 | $42,508 |
| 2019 | $2,245 | $56,060 | $13,552 | $42,508 |
| 2018 | $1,793 | $47,310 | $11,440 | $35,870 |
| 2017 | $1,793 | $47,310 | $11,440 | $35,870 |
| 2016 | $1,797 | $47,310 | $11,440 | $35,870 |
| 2014 | $1,561 | $40,120 | $9,940 | $30,180 |
| 2013 | $1,522 | $40,120 | $9,940 | $30,180 |
Source: Public Records
Map
Nearby Homes
- 191 Heritage Crossing SE
- 264 Pleasant Valley Rd NW
- 201 Parkhill Dr NE
- 430 Bahler St SW
- 0 W Main St Unit 5163516
- 0 W Main St Unit 5163469
- 806 W Main St
- 0 W Main Street Rear
- 834 Geneva St SW
- 0 Miller Ave SW
- 0 Miller Ave SW
- 0 Miller Ave SW
- 0 SW Main St Rear
- 128 Rhine St SW
- 325 Lugano St SW
- 5827 Old Route 39 NW
- 3153 Boltz Orchard Rd SW
- 4534 Township Road 447
- 10624 Hilltop Rd
- 5181 State Route 516 NW
- 8452 Sugarcreek Rd NW
- 8484 Sugarcreek Rd NW
- 8556 Sugarcreek Rd NW
- 235 Ragersville Rd NW
- 311 Ragersville Rd NW
- 445 Ragersville Rd NW
- 513 Ragersville Rd NW
- 8342 Steinebrey Ridge Rd NW
- 137 Ragersville Rd NW
- 209 Ragersville Rd NW
- 8655 Sugarcreek Rd NW
- 107 Ragersville Rd NW
- 169 Ragersville Rd NW
- 768 Ragersville Rd NW
- 768 Ragersville Rd NW
- 8064 Sugarcreek Rd NW
- 8384 Steinebrey Ridge Rd NW
- 8465 Bollman Rd SW
- 8465 Bollman Rd SW
- 8670 Steinebrey Ridge Rd NW