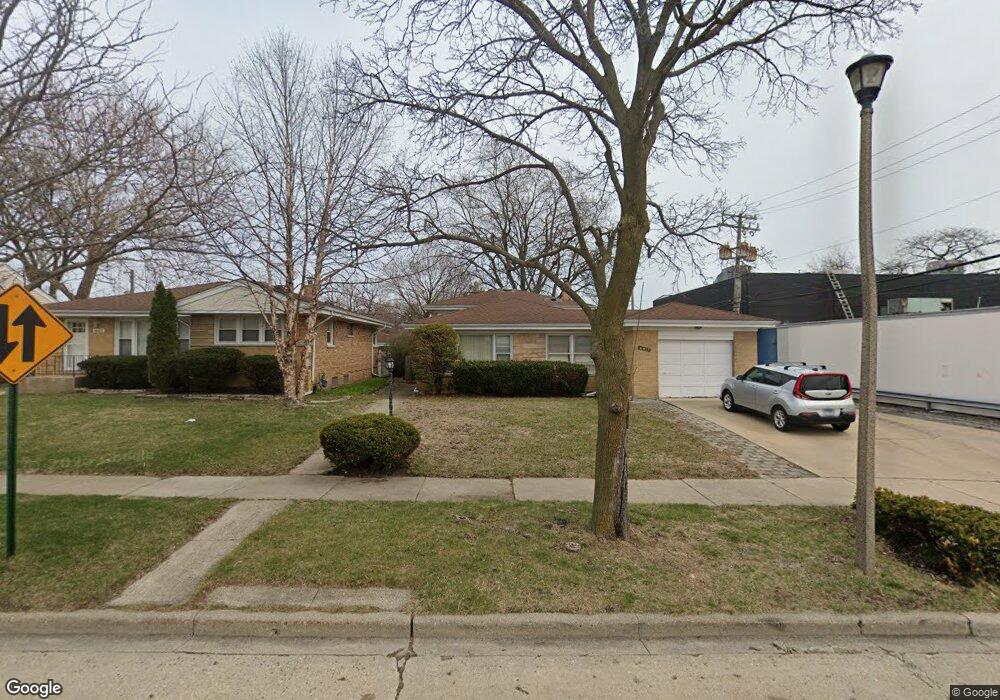
8417 Latrobe Ave Skokie, IL 60077
Southwest Skokie NeighborhoodEstimated Value: $443,480 - $518,000
3
Beds
2
Baths
1,269
Sq Ft
$369/Sq Ft
Est. Value
About This Home
This home is located at 8417 Latrobe Ave, Skokie, IL 60077 and is currently estimated at $468,120, approximately $368 per square foot. 8417 Latrobe Ave is a home located in Cook County with nearby schools including Madison Elementary School, Thomas Edison Elementary School, and Lincoln Junior High School.
Ownership History
Date
Name
Owned For
Owner Type
Purchase Details
Closed on
Aug 17, 2009
Sold by
Chough Chang Soon
Bought by
Chough Chang Soon and Chough Min E
Current Estimated Value
Home Financials for this Owner
Home Financials are based on the most recent Mortgage that was taken out on this home.
Original Mortgage
$236,000
Outstanding Balance
$154,500
Interest Rate
5.29%
Mortgage Type
New Conventional
Estimated Equity
$313,620
Purchase Details
Closed on
Apr 22, 2004
Sold by
Seol Kum Ki and Seol Hang Jun
Bought by
Chough Chang Soon
Home Financials for this Owner
Home Financials are based on the most recent Mortgage that was taken out on this home.
Original Mortgage
$262,000
Interest Rate
4.75%
Mortgage Type
Unknown
Purchase Details
Closed on
Jan 20, 2004
Sold by
Seol Kum Ki
Bought by
Seol Kum Ki and Seol Hang Jun
Purchase Details
Closed on
Aug 16, 1999
Sold by
Seol Hang Jun and Seol Kumi Ki
Bought by
Seol Kum Ki
Home Financials for this Owner
Home Financials are based on the most recent Mortgage that was taken out on this home.
Original Mortgage
$168,750
Interest Rate
7.5%
Create a Home Valuation Report for This Property
The Home Valuation Report is an in-depth analysis detailing your home's value as well as a comparison with similar homes in the area
Home Values in the Area
Average Home Value in this Area
Purchase History
| Date | Buyer | Sale Price | Title Company |
|---|---|---|---|
| Chough Chang Soon | -- | Rtc | |
| Chough Chang Soon | $310,000 | -- | |
| Seol Kum Ki | -- | -- | |
| Seol Kum Ki | -- | -- |
Source: Public Records
Mortgage History
| Date | Status | Borrower | Loan Amount |
|---|---|---|---|
| Open | Chough Chang Soon | $236,000 | |
| Closed | Chough Chang Soon | $262,000 | |
| Previous Owner | Seol Kum Ki | $168,750 |
Source: Public Records
Tax History Compared to Growth
Tax History
| Year | Tax Paid | Tax Assessment Tax Assessment Total Assessment is a certain percentage of the fair market value that is determined by local assessors to be the total taxable value of land and additions on the property. | Land | Improvement |
|---|---|---|---|---|
| 2024 | $6,180 | $36,000 | $8,451 | $27,549 |
| 2023 | $9,303 | $36,000 | $8,451 | $27,549 |
| 2022 | $9,303 | $36,000 | $8,451 | $27,549 |
| 2021 | $7,209 | $28,362 | $5,200 | $23,162 |
| 2020 | $6,668 | $28,362 | $5,200 | $23,162 |
| 2019 | $6,589 | $31,868 | $5,200 | $26,668 |
| 2018 | $8,335 | $26,717 | $4,713 | $22,004 |
| 2017 | $8,394 | $26,717 | $4,713 | $22,004 |
| 2016 | $8,607 | $27,898 | $4,713 | $23,185 |
| 2015 | $7,596 | $23,897 | $4,063 | $19,834 |
| 2014 | $7,445 | $23,897 | $4,063 | $19,834 |
| 2013 | $7,523 | $23,897 | $4,063 | $19,834 |
Source: Public Records
Map
Nearby Homes
- 8461 Gross Point Rd
- 8605 Laramie Ave
- 5109 Greenleaf St
- 5148 Cleveland St
- 5001 Madison St Unit 3A
- 8232 Niles Center Rd Unit 202
- 8232 Niles Center Rd Unit 317
- 5253 Cleveland St
- 5500 Lincoln Ave
- 5500 Lincoln Ave Unit 116E
- 5500 Lincoln Ave Unit 109W
- 8541 Lotus Ave Unit 914
- 5309 Crain St
- 8534 Terminal Ave
- 5501 Lincoln Ave Unit 203
- 8717 Gross Point Rd
- 5249 Hoffman St
- 8230 Elmwood St Unit 405
- 5510 Lincoln Ave Unit B301
- 5510 Lincoln Ave Unit B101
- 8421 Latrobe Ave
- 8429 Latrobe Ave
- 8416 Laramie Ave
- 8420 Laramie Ave
- 8424 Laramie Ave
- 8433 Latrobe Ave
- 8428 Laramie Ave
- 8428 Laramie Ave
- 8420 Latrobe Ave
- 5200 Main St
- 8424 Latrobe Ave
- 8432 Laramie Ave
- 8430 Latrobe Ave
- 8441 Latrobe Ave
- 8436 Laramie Ave
- 8436 Latrobe Ave
- 8445 Latrobe Ave
- 8440 Laramie Ave
- 5266 Lincoln Ave
- 5154 Main St