Estimated Value: $286,000 - $334,000
3
Beds
2
Baths
1,724
Sq Ft
$181/Sq Ft
Est. Value
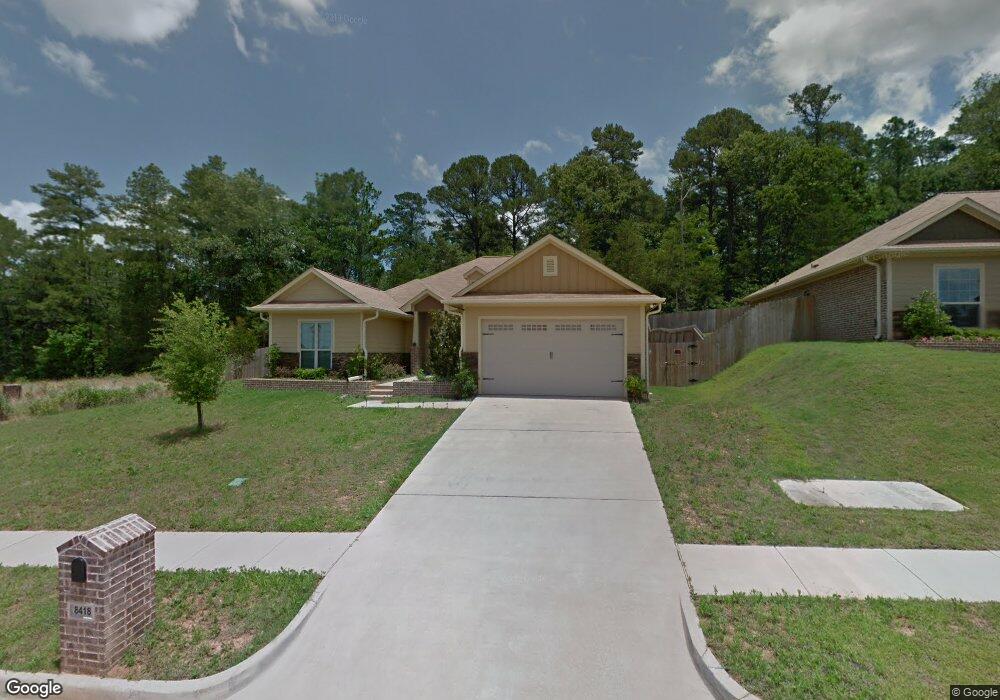
About This Home
This home is located at 8418 8418 Lakeway Dr, Tyler, TX 75703 and is currently estimated at $311,281, approximately $180 per square foot. 8418 8418 Lakeway Dr is a home located in Smith County with nearby schools including Dr. Bryan C. Jack Elementary School, Hubbard Middle School, and Tyler Legacy High School.
Ownership History
Date
Name
Owned For
Owner Type
Purchase Details
Closed on
Sep 8, 2025
Sold by
Prince Glen D and Prince Diane M
Bought by
Prince Living Trust and Prince
Current Estimated Value
Purchase Details
Closed on
Oct 18, 2022
Sold by
Lacroix Edwin F
Bought by
Prince Glen D and Prince Diane M
Purchase Details
Closed on
Jan 23, 2015
Sold by
Hoppie Grant Durlin
Bought by
Ashley Lacroix Edwin F and Ashley Anthony
Home Financials for this Owner
Home Financials are based on the most recent Mortgage that was taken out on this home.
Original Mortgage
$149,840
Interest Rate
3.97%
Mortgage Type
New Conventional
Purchase Details
Closed on
Jun 19, 2012
Sold by
Mazaye Building Ltd
Bought by
Hoppie Amber and Hoppie Grant
Home Financials for this Owner
Home Financials are based on the most recent Mortgage that was taken out on this home.
Original Mortgage
$173,426
Interest Rate
4.25%
Mortgage Type
FHA
Create a Home Valuation Report for This Property
The Home Valuation Report is an in-depth analysis detailing your home's value as well as a comparison with similar homes in the area
Home Values in the Area
Average Home Value in this Area
Purchase History
| Date | Buyer | Sale Price | Title Company |
|---|---|---|---|
| Prince Living Trust | -- | None Listed On Document | |
| Prince Glen D | -- | -- | |
| Ashley Lacroix Edwin F | -- | None Available | |
| Hoppie Amber | -- | Ctc |
Source: Public Records
Mortgage History
| Date | Status | Borrower | Loan Amount |
|---|---|---|---|
| Previous Owner | Ashley Lacroix Edwin F | $149,840 | |
| Previous Owner | Hoppie Amber | $173,426 |
Source: Public Records
Tax History Compared to Growth
Tax History
| Year | Tax Paid | Tax Assessment Tax Assessment Total Assessment is a certain percentage of the fair market value that is determined by local assessors to be the total taxable value of land and additions on the property. | Land | Improvement |
|---|---|---|---|---|
| 2025 | $3,627 | $334,600 | $43,832 | $290,768 |
| 2024 | $3,627 | $325,258 | $60,407 | $308,533 |
| 2023 | $5,154 | $295,689 | $60,407 | $235,282 |
| 2022 | $4,352 | $222,605 | $32,779 | $189,826 |
| 2021 | $4,237 | $201,943 | $32,779 | $169,164 |
| 2020 | $4,358 | $203,668 | $32,779 | $170,889 |
| 2019 | $4,319 | $197,505 | $32,779 | $164,726 |
| 2018 | $4,154 | $190,994 | $32,779 | $158,215 |
| 2017 | $4,078 | $190,994 | $32,779 | $158,215 |
| 2016 | $4,083 | $191,253 | $32,779 | $158,474 |
| 2015 | $3,872 | $186,700 | $32,779 | $153,921 |
| 2014 | $3,872 | $182,199 | $32,779 | $149,420 |
Source: Public Records
Map
Nearby Homes
- 7883 Greenhill Dr
- 7898 Greenhill Dr
- 7892 Greenhill Dr
- 7941 Greenhill Dr
- 7942 Greenhill Dr
- 7908 Greenhill Dr
- 7902 Greenhill Dr
- 421 W Cumberland Rd
- 421 W Cumberland Rd Unit 1402
- The Beckham Plan at Cumberland Place West
- The Tanglewood Plan at Cumberland Place West
- The Augusta Plan at Cumberland Place West
- The Donnybrook Plan at Cumberland Place West
- The Charnwood Plan at Cumberland Place West
- The Belmont Plan at Cumberland Place West
- The Tanglewood Plus Plan at Cumberland Place West
- The Elgem Plan at Cumberland Place West
- The Glenwood Plan at Cumberland Place West
- The Drexel Plan at Cumberland Place West
- The Elgem Plus Plan at Cumberland Place West
- 8418 Lakeway Dr
- 8412 Lakeway Dr
- 8424 8424 Lakeway Dr
- 8430 8430 Lakeway Dr
- 8430 Lakeway Dr
- 8406 Lakeway Dr
- 8423 Lakeway Dr
- 8417 Lakeway Dr
- 8402 Lakeway Dr
- 8436 Lakeway Dr
- 8429 Lakeway Dr
- 8411 Lakeway Dr
- 8435 Lakeway Dr
- 8508 Lakeway Dr
- 8405 Lakeway Dr
- 8441 Lakeway Dr
- 413 W Cumberland Rd
- 321 W Cumberland Rd
- 315 W Cumberland Rd
- 412 W Cumberland Rd