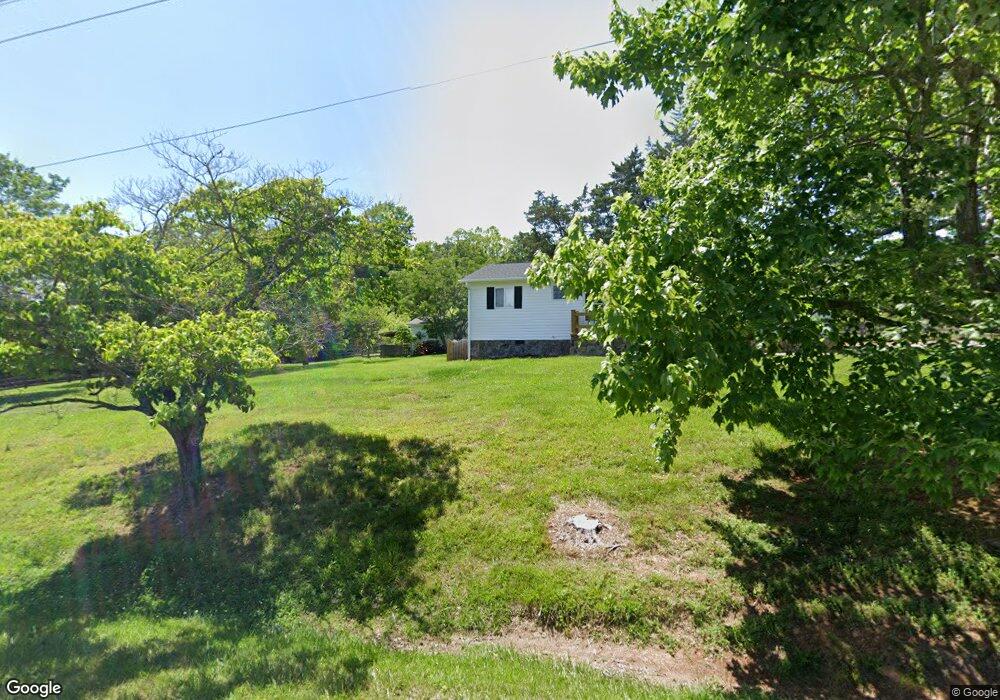
8419 S Lowell Rd Bahama, NC 27503
Estimated Value: $300,750 - $384,000
2
Beds
1
Bath
1,248
Sq Ft
$267/Sq Ft
Est. Value
About This Home
This home is located at 8419 S Lowell Rd, Bahama, NC 27503 and is currently estimated at $333,188, approximately $266 per square foot. 8419 S Lowell Rd is a home located in Durham County with nearby schools including Mangum Elementary School, Lucas Middle School, and Northern High School.
Ownership History
Date
Name
Owned For
Owner Type
Purchase Details
Closed on
Jan 8, 2024
Sold by
Allen Tracy Thomas and Allen Natasha
Bought by
Pendergraft Kayla
Current Estimated Value
Home Financials for this Owner
Home Financials are based on the most recent Mortgage that was taken out on this home.
Original Mortgage
$233,000
Outstanding Balance
$229,822
Interest Rate
5%
Mortgage Type
Construction
Estimated Equity
$103,366
Purchase Details
Closed on
Nov 17, 2022
Sold by
Standish Robert Miles and Standish Cheri J
Bought by
Allen Tracy Thomas
Purchase Details
Closed on
May 6, 2019
Sold by
Daniel Barbara A
Bought by
Standish Robert Miles and Standish Cheri J
Purchase Details
Closed on
Jul 22, 2014
Sold by
Estate Of Mary B Pope and Pope Dail Forrast
Bought by
Daniel Barbara A
Home Financials for this Owner
Home Financials are based on the most recent Mortgage that was taken out on this home.
Original Mortgage
$51,200
Interest Rate
4.2%
Mortgage Type
New Conventional
Create a Home Valuation Report for This Property
The Home Valuation Report is an in-depth analysis detailing your home's value as well as a comparison with similar homes in the area
Home Values in the Area
Average Home Value in this Area
Purchase History
| Date | Buyer | Sale Price | Title Company |
|---|---|---|---|
| Pendergraft Kayla | $295,000 | None Listed On Document | |
| Pendergraft Kayla | $295,000 | None Listed On Document | |
| Allen Tracy Thomas | -- | -- | |
| Allen Tracy Thomas | -- | None Listed On Document | |
| Standish Robert Miles | $47,000 | None Available | |
| Daniel Barbara A | $64,000 | None Available |
Source: Public Records
Mortgage History
| Date | Status | Borrower | Loan Amount |
|---|---|---|---|
| Open | Pendergraft Kayla | $233,000 | |
| Closed | Pendergraft Kayla | $233,000 | |
| Previous Owner | Daniel Barbara A | $51,200 |
Source: Public Records
Tax History Compared to Growth
Tax History
| Year | Tax Paid | Tax Assessment Tax Assessment Total Assessment is a certain percentage of the fair market value that is determined by local assessors to be the total taxable value of land and additions on the property. | Land | Improvement |
|---|---|---|---|---|
| 2025 | $2,391 | $327,127 | $69,300 | $257,827 |
| 2024 | $1,618 | $148,105 | $34,537 | $113,568 |
| 2023 | $1,533 | $148,105 | $34,537 | $113,568 |
| 2022 | $1,468 | $148,105 | $34,537 | $113,568 |
| 2021 | $1,255 | $148,105 | $34,537 | $113,568 |
| 2020 | $1,229 | $148,105 | $34,537 | $113,568 |
| 2019 | $1,229 | $148,105 | $34,537 | $113,568 |
| 2018 | $740 | $82,764 | $19,187 | $63,577 |
| 2017 | $731 | $82,764 | $19,187 | $63,577 |
| 2016 | $700 | $82,764 | $19,187 | $63,577 |
| 2015 | $880 | $82,336 | $28,821 | $53,515 |
| 2014 | $880 | $82,336 | $28,821 | $53,515 |
Source: Public Records
Map
Nearby Homes
- 8200 Bromley Rd
- 7433 Guess Rd
- 7421 Guess Rd
- 7415 Guess Rd
- 7409 Guess Rd
- 7122 Guess Rd
- 7120 Guess Rd
- 0 Little River Dr Unit 10119715
- 7105 Guess Rd
- 7610 Buckhorn Rd
- 7008 Windover Dr
- 9625 S Lowell Rd
- 8313 Polaris Dr
- 8635 Johnson Mill Rd
- 8636 Johnson Mill Rd
- 2 Steepleton Ct
- 6817 Guess Rd
- 6814 Windover Dr
- 5 Penwick Place
- 6740 Guess Rd
- 8509 S Lowell Rd Unit S
- 8318 S Lowell Rd
- 8411 S Lowell Rd
- 8212 S Lowell Rd
- 8311 Johnson Mill Rd
- 1322 Lindale Dr
- 1322 Lindale Rd
- 1219 Lindale Dr Unit 2
- 1219 Lindale Dr
- 8530 S Lowell Rd
- 8610 S Lowell Rd
- 8313 Johnson Mill Rd
- 1218 Lindale Dr
- 102 Vista Del Rio Dr Unit 10201
- 102 Vista Del Rio Dr
- 106 Visatndel Rio Dr
- 106 Vista Del Rio Dr
- 1217 Lindale Rd
- 1217 Lindale Dr
- 147 Bagby Ln