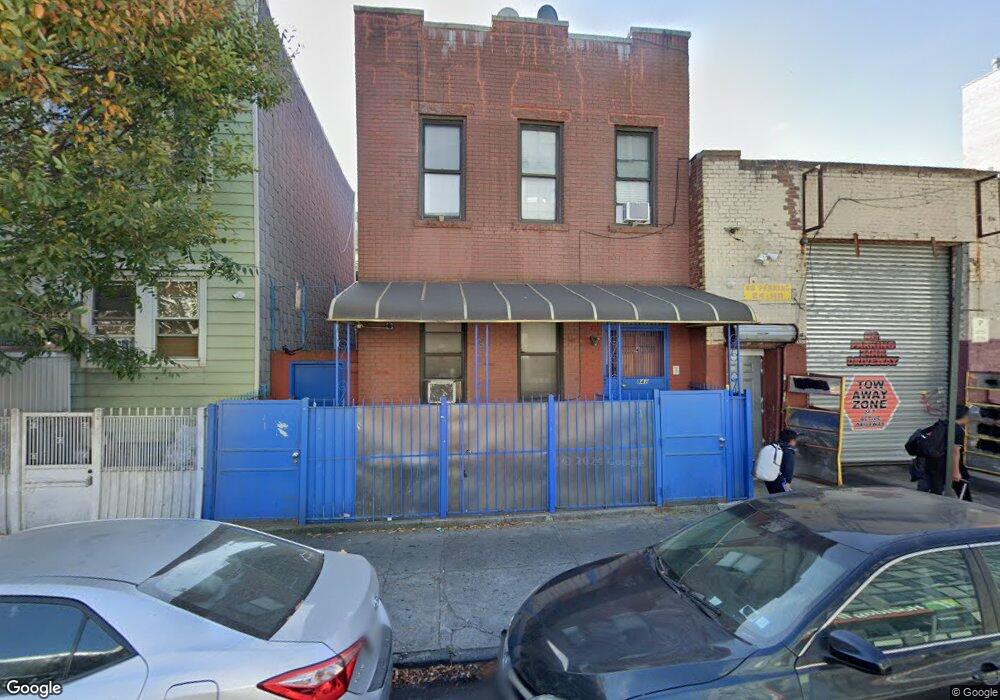
842 39th St Brooklyn, NY 11232
Sunset Park NeighborhoodEstimated Value: $1,165,000 - $1,385,000
Studio
--
Bath
1,728
Sq Ft
$752/Sq Ft
Est. Value
About This Home
This home is located at 842 39th St, Brooklyn, NY 11232 and is currently estimated at $1,299,175, approximately $751 per square foot. 842 39th St is a home located in Kings County with nearby schools including P.S. 169 Sunset Park, I.S. 223 The Montauk, and Bnos Margulia Viznitz.
Ownership History
Date
Name
Owned For
Owner Type
Purchase Details
Closed on
Dec 9, 2020
Sold by
Tsang Chau Har and Wu Yick Kwan
Bought by
Chau Har Tsang As Trustee and Chau Har Tsang Revocable Trust
Current Estimated Value
Purchase Details
Closed on
Sep 4, 2013
Sold by
Lin Cui Zhen
Bought by
Tsang Chau Har and Wu Yick Kwan
Purchase Details
Closed on
Jun 12, 2006
Sold by
Wang Yin Hua
Bought by
Lin Cui Zhen
Home Financials for this Owner
Home Financials are based on the most recent Mortgage that was taken out on this home.
Original Mortgage
$490,000
Interest Rate
6.59%
Mortgage Type
Purchase Money Mortgage
Purchase Details
Closed on
Sep 13, 2000
Sold by
Gomez Jose A
Bought by
Wang Yin Hua
Home Financials for this Owner
Home Financials are based on the most recent Mortgage that was taken out on this home.
Original Mortgage
$200,000
Interest Rate
7.94%
Create a Home Valuation Report for This Property
The Home Valuation Report is an in-depth analysis detailing your home's value as well as a comparison with similar homes in the area
Home Values in the Area
Average Home Value in this Area
Purchase History
| Date | Buyer | Sale Price | Title Company |
|---|---|---|---|
| Chau Har Tsang As Trustee | -- | -- | |
| Tsang Chau Har | $758,000 | -- | |
| Lin Cui Zhen | $683,000 | -- | |
| Wang Yin Hua | $255,000 | Chicago Title Insurance Co |
Source: Public Records
Mortgage History
| Date | Status | Borrower | Loan Amount |
|---|---|---|---|
| Previous Owner | Lin Cui Zhen | $490,000 | |
| Previous Owner | Wang Yin Hua | $200,000 |
Source: Public Records
Tax History
| Year | Tax Paid | Tax Assessment Tax Assessment Total Assessment is a certain percentage of the fair market value that is determined by local assessors to be the total taxable value of land and additions on the property. | Land | Improvement |
|---|---|---|---|---|
| 2026 | $4,936 | $77,400 | $31,380 | $46,020 |
| 2025 | $4,663 | $74,100 | $31,380 | $42,720 |
| 2024 | $4,663 | $84,360 | $31,380 | $52,980 |
| 2023 | $4,671 | $75,780 | $31,380 | $44,400 |
| 2022 | $4,334 | $62,040 | $31,380 | $30,660 |
| 2021 | $4,312 | $58,860 | $31,380 | $27,480 |
| 2020 | $2,143 | $60,960 | $31,380 | $29,580 |
| 2019 | $4,047 | $64,380 | $31,380 | $33,000 |
| 2018 | $3,907 | $19,166 | $6,975 | $12,191 |
| 2017 | $3,688 | $18,093 | $8,689 | $9,404 |
| 2016 | $3,414 | $17,076 | $9,901 | $7,175 |
| 2015 | $2,059 | $17,067 | $10,368 | $6,699 |
| 2014 | $2,059 | $16,123 | $8,651 | $7,472 |
Source: Public Records
Map
Nearby Homes
- 817 40th St
- 3912 9th Ave
- 3924 9th Ave
- 334 39th St
- 4002 8th Ave
- 872 41st St
- 4105 8th Ave
- 4022 8th Ave Unit 5B
- 4022 8th Ave Unit 4A
- 755 40th St Unit 3C
- 756 40th St Unit 1R
- 762 41st St Unit 5B
- 744 39th St
- 3929 New Utrecht Ave Unit 4B
- 719 41st St
- 842 43rd St
- 848 43rd St Unit 22
- 826 43rd St Unit 1
- 3903 7th Ave
- 3921 7th Ave
Your Personal Tour Guide
Ask me questions while you tour the home.