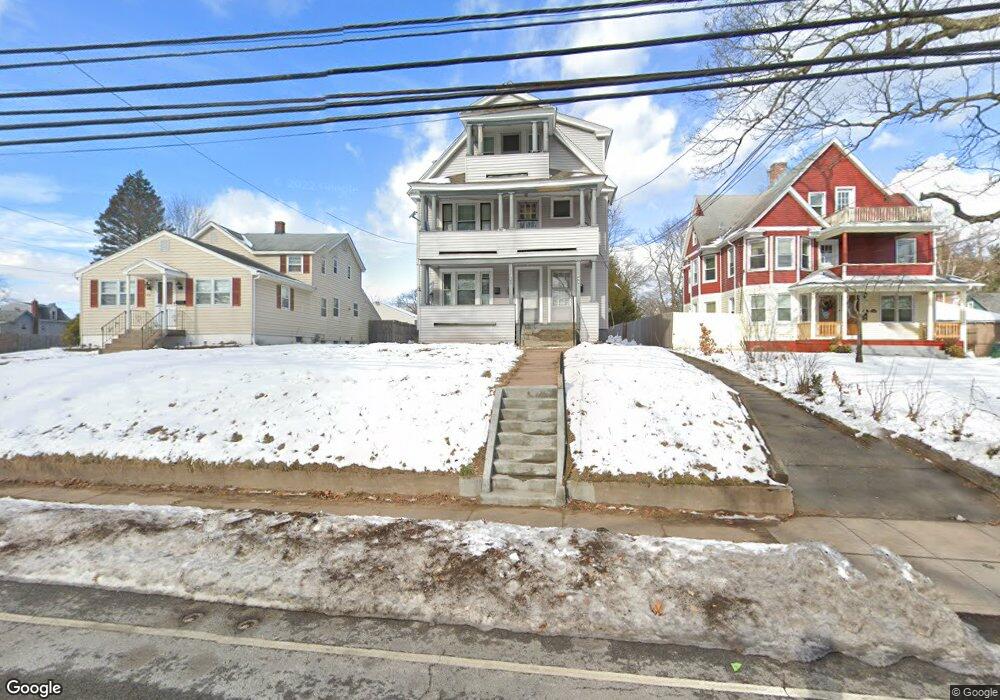
842 Burnside Ave East Hartford, CT 06108
Estimated Value: $389,000 - $468,000
6
Beds
3
Baths
3,274
Sq Ft
$134/Sq Ft
Est. Value
About This Home
This home is located at 842 Burnside Ave, East Hartford, CT 06108 and is currently estimated at $437,835, approximately $133 per square foot. 842 Burnside Ave is a home located in Hartford County with nearby schools including Dr. Franklin H. Mayberry School, East Hartford Middle School, and East Hartford High School.
Ownership History
Date
Name
Owned For
Owner Type
Purchase Details
Closed on
Dec 18, 2006
Sold by
Hyman Hubert
Bought by
Copeland Henry J
Current Estimated Value
Home Financials for this Owner
Home Financials are based on the most recent Mortgage that was taken out on this home.
Original Mortgage
$271,600
Outstanding Balance
$153,188
Interest Rate
6.31%
Estimated Equity
$284,647
Purchase Details
Closed on
Mar 2, 2006
Sold by
Fetta Elise M
Bought by
Hyman Hubert
Home Financials for this Owner
Home Financials are based on the most recent Mortgage that was taken out on this home.
Original Mortgage
$200,000
Interest Rate
9.85%
Purchase Details
Closed on
Sep 12, 2005
Sold by
Grasso Angelo and Grasso Joyce
Bought by
Fetta Elise M
Home Financials for this Owner
Home Financials are based on the most recent Mortgage that was taken out on this home.
Original Mortgage
$175,000
Interest Rate
5.79%
Create a Home Valuation Report for This Property
The Home Valuation Report is an in-depth analysis detailing your home's value as well as a comparison with similar homes in the area
Home Values in the Area
Average Home Value in this Area
Purchase History
| Date | Buyer | Sale Price | Title Company |
|---|---|---|---|
| Copeland Henry J | $280,000 | -- | |
| Hyman Hubert | $250,000 | -- | |
| Fetta Elise M | $149,900 | -- |
Source: Public Records
Mortgage History
| Date | Status | Borrower | Loan Amount |
|---|---|---|---|
| Open | Fetta Elise M | $271,600 | |
| Previous Owner | Fetta Elise M | $200,000 | |
| Previous Owner | Fetta Elise M | $175,000 |
Source: Public Records
Tax History Compared to Growth
Tax History
| Year | Tax Paid | Tax Assessment Tax Assessment Total Assessment is a certain percentage of the fair market value that is determined by local assessors to be the total taxable value of land and additions on the property. | Land | Improvement |
|---|---|---|---|---|
| 2025 | $8,531 | $185,860 | $36,880 | $148,980 |
| 2024 | $8,178 | $185,860 | $36,880 | $148,980 |
| 2023 | $7,906 | $185,860 | $36,880 | $148,980 |
| 2022 | $7,620 | $185,860 | $36,880 | $148,980 |
| 2021 | $6,493 | $131,570 | $27,940 | $103,630 |
| 2020 | $6,568 | $131,570 | $27,940 | $103,630 |
| 2019 | $6,461 | $131,570 | $27,940 | $103,630 |
| 2018 | $6,271 | $131,570 | $27,940 | $103,630 |
| 2017 | $6,190 | $131,570 | $27,940 | $103,630 |
| 2016 | $6,034 | $131,570 | $27,940 | $103,630 |
| 2015 | $6,034 | $131,570 | $27,940 | $103,630 |
| 2014 | $5,973 | $131,570 | $27,940 | $103,630 |
Source: Public Records
Map
Nearby Homes
- 3 Price Ct
- 8 Howard Ct Unit 10
- 40 Larrabee St
- 73 Bliss St
- 26 Casabella Cir Unit 28
- 59 Laraia Ave
- 0 Hillside Ave
- 71 Higbie Dr Unit 73
- 952 Tolland St
- 421 Tolland St
- 421 Tolland St Unit 209
- 61 Leverich Dr
- 21 Highview St
- 22 Matthew Rd
- 89 Henderson Dr
- 509 Burnside Ave Unit A18
- 15 Michael Ave
- 506 Burnside Ave
- 51 Daniel St
- 577 Goodwin St
- 846 Burnside Ave Unit 848
- 848 Burnside Ave
- 846 Burnside Ave Unit 1ST
- 840 Burnside Ave
- 846 Burnside Ave (1st Fl)
- 834 Burnside Ave
- 79 Larrabee St
- 858 Burnside Ave Unit 860
- 91 Larrabee St Unit 93
- 835 Burnside Ave
- 5 Price Ct
- 85 Larrabee St
- 822 Burnside Ave
- 87 Larrabee St Unit 89
- 841 Burnside Ave
- 786-788 Burnside Ave
- 69 Larrabee St Unit 71
- 864 Burnside Ave
- 95 Larrabee St Unit 97