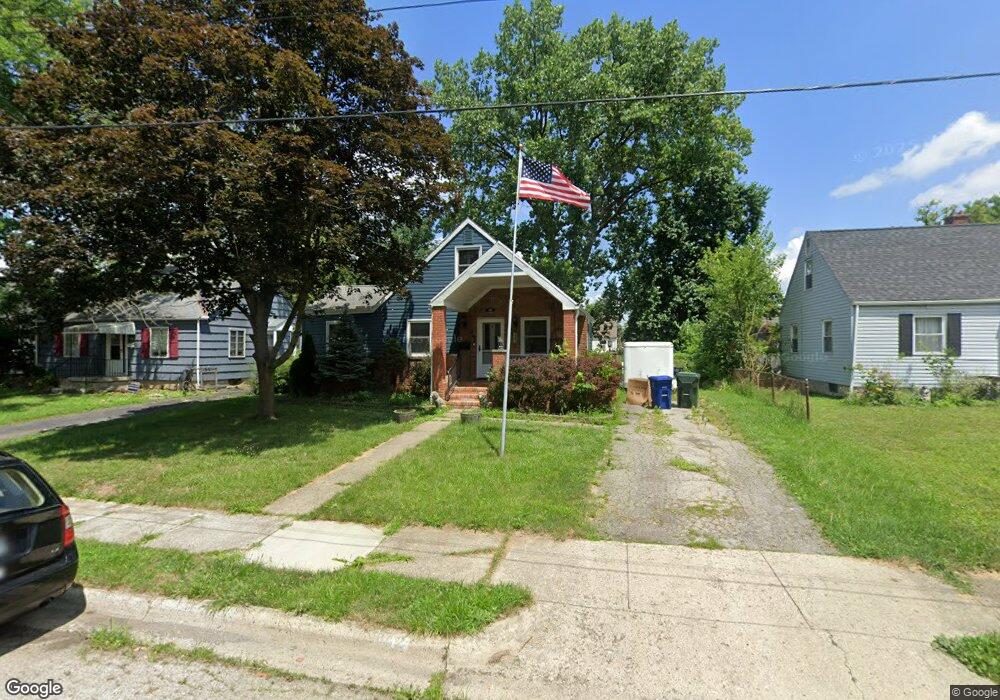
842 E Kenworth Rd Columbus, OH 43224
North Linden NeighborhoodEstimated Value: $191,000 - $228,000
2
Beds
2
Baths
1,358
Sq Ft
$151/Sq Ft
Est. Value
About This Home
This home is located at 842 E Kenworth Rd, Columbus, OH 43224 and is currently estimated at $204,968, approximately $150 per square foot. 842 E Kenworth Rd is a home located in Franklin County with nearby schools including Como Elementary School, Dominion Middle School, and Whetstone High School.
Ownership History
Date
Name
Owned For
Owner Type
Purchase Details
Closed on
May 15, 2002
Sold by
Tcif Re02 Llc
Bought by
Hopper Jeffrey A
Current Estimated Value
Home Financials for this Owner
Home Financials are based on the most recent Mortgage that was taken out on this home.
Original Mortgage
$49,400
Outstanding Balance
$20,962
Interest Rate
7%
Mortgage Type
Purchase Money Mortgage
Estimated Equity
$184,006
Purchase Details
Closed on
Apr 24, 2002
Sold by
Old Kent Mtg Company
Bought by
Tcif Re02 Llc
Home Financials for this Owner
Home Financials are based on the most recent Mortgage that was taken out on this home.
Original Mortgage
$49,400
Outstanding Balance
$20,962
Interest Rate
7%
Mortgage Type
Purchase Money Mortgage
Estimated Equity
$184,006
Purchase Details
Closed on
Mar 16, 1989
Bought by
White Franklin E
Purchase Details
Closed on
Sep 1, 1983
Create a Home Valuation Report for This Property
The Home Valuation Report is an in-depth analysis detailing your home's value as well as a comparison with similar homes in the area
Home Values in the Area
Average Home Value in this Area
Purchase History
| Date | Buyer | Sale Price | Title Company |
|---|---|---|---|
| Hopper Jeffrey A | $52,000 | Amerititle Mill Run | |
| Tcif Re02 Llc | $52,000 | Amerititle Mill Run | |
| White Franklin E | $51,400 | -- | |
| -- | -- | -- |
Source: Public Records
Mortgage History
| Date | Status | Borrower | Loan Amount |
|---|---|---|---|
| Open | Hopper Jeffrey A | $49,400 | |
| Closed | Tcif Re02 Llc | $49,400 |
Source: Public Records
Tax History Compared to Growth
Tax History
| Year | Tax Paid | Tax Assessment Tax Assessment Total Assessment is a certain percentage of the fair market value that is determined by local assessors to be the total taxable value of land and additions on the property. | Land | Improvement |
|---|---|---|---|---|
| 2024 | $2,295 | $60,940 | $15,400 | $45,540 |
| 2023 | $2,294 | $60,940 | $15,400 | $45,540 |
| 2022 | $1,414 | $36,020 | $8,020 | $28,000 |
| 2021 | $1,417 | $36,020 | $8,020 | $28,000 |
| 2020 | $1,419 | $36,020 | $8,020 | $28,000 |
| 2019 | $1,251 | $29,370 | $6,690 | $22,680 |
| 2018 | $1,057 | $29,370 | $6,690 | $22,680 |
| 2017 | $1,102 | $29,370 | $6,690 | $22,680 |
| 2016 | $953 | $23,140 | $4,270 | $18,870 |
| 2015 | $865 | $23,140 | $4,270 | $18,870 |
| 2014 | $867 | $23,140 | $4,270 | $18,870 |
| 2013 | $504 | $25,690 | $4,725 | $20,965 |
Source: Public Records
Map
Nearby Homes
- 759 E Longview Ave
- 3468 Kimberly Ave Unit 470
- 612 E Como Ave
- 3546 Beulah Rd
- 886 Carolyn Ave
- 3216 Howey Rd
- 2923 Azelda St
- 3147 Grasmere Ave
- 775 E Weber Rd
- 1090 Pauline Ave
- 780 Moon Rd
- 555 E Weber Rd
- 3043 McGuffey Rd
- 2899 Howey Rd
- 2950 Grasmere Ave
- 3268 McGuffey Rd
- 467 Brevoort Rd
- 580 Crestview Rd
- 924 Northridge Rd
- 3071 Karl Rd
- 846 E Kenworth Rd
- 836 E Kenworth Rd
- 852 E Kenworth Rd
- 828 E Kenworth Rd
- 853 Oakland Park Ave
- 3283 Reis Ave Unit 855
- 3285 Reis Ave Unit 855
- 845 Oakland Park Ave
- 3287 Reis Ave Unit 855
- 855 Oakland Park Ave Unit 855
- 818 E Kenworth Rd
- 3289 Reis Ave Unit 855
- 857 Oakland Park Ave Unit 855
- 845 E Kenworth Rd
- 839 E Kenworth Rd
- 3291 Reis Ave Unit 855
- 859 Oakland Park Ave Unit 855
- 837 Oakland Park Ave
- 861 Oakland Park Ave Unit 855
- 851 E Kenworth Rd