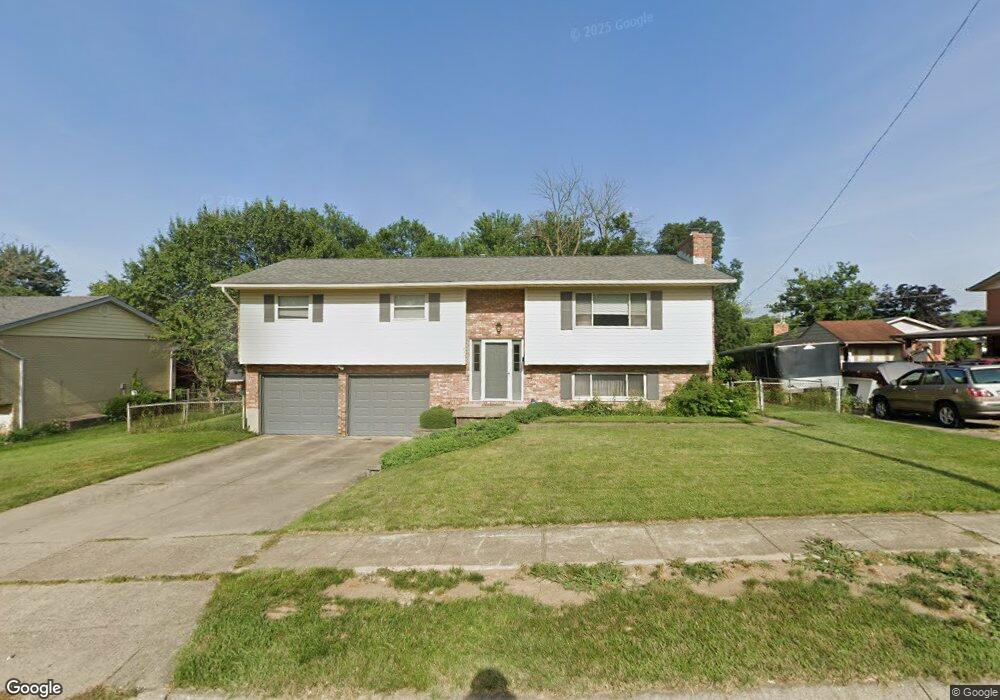
842 Lea Ave Miamisburg, OH 45342
Downtown Miamisburg NeighborhoodEstimated Value: $257,000 - $278,089
3
Beds
3
Baths
1,343
Sq Ft
$201/Sq Ft
Est. Value
About This Home
This home is located at 842 Lea Ave, Miamisburg, OH 45342 and is currently estimated at $269,272, approximately $200 per square foot. 842 Lea Ave is a home located in Montgomery County with nearby schools including Miamisburg High School and Bethel Baptist School.
Ownership History
Date
Name
Owned For
Owner Type
Purchase Details
Closed on
Dec 9, 2004
Sold by
Holdren Charles R and Holdren Diane G
Bought by
Miami Merger Properties Llc
Current Estimated Value
Purchase Details
Closed on
Apr 23, 2004
Sold by
Sakal Martha S
Bought by
Holdren Charles R and Holdren Diane G
Home Financials for this Owner
Home Financials are based on the most recent Mortgage that was taken out on this home.
Original Mortgage
$111,200
Interest Rate
5.48%
Mortgage Type
Purchase Money Mortgage
Create a Home Valuation Report for This Property
The Home Valuation Report is an in-depth analysis detailing your home's value as well as a comparison with similar homes in the area
Home Values in the Area
Average Home Value in this Area
Purchase History
| Date | Buyer | Sale Price | Title Company |
|---|---|---|---|
| Miami Merger Properties Llc | -- | None Available | |
| Holdren Charles R | $139,000 | -- |
Source: Public Records
Mortgage History
| Date | Status | Borrower | Loan Amount |
|---|---|---|---|
| Previous Owner | Holdren Charles R | $111,200 |
Source: Public Records
Tax History Compared to Growth
Tax History
| Year | Tax Paid | Tax Assessment Tax Assessment Total Assessment is a certain percentage of the fair market value that is determined by local assessors to be the total taxable value of land and additions on the property. | Land | Improvement |
|---|---|---|---|---|
| 2024 | $4,920 | $75,790 | $12,250 | $63,540 |
| 2023 | $4,920 | $75,790 | $12,250 | $63,540 |
| 2022 | $4,170 | $54,140 | $8,750 | $45,390 |
| 2021 | $3,702 | $54,140 | $8,750 | $45,390 |
| 2020 | $3,693 | $54,140 | $8,750 | $45,390 |
| 2019 | $3,319 | $44,610 | $8,750 | $35,860 |
| 2018 | $3,330 | $44,610 | $8,750 | $35,860 |
| 2017 | $3,310 | $44,610 | $8,750 | $35,860 |
| 2016 | $3,027 | $39,280 | $8,750 | $30,530 |
| 2015 | $2,969 | $39,280 | $8,750 | $30,530 |
| 2014 | $2,969 | $39,280 | $8,750 | $30,530 |
| 2012 | -- | $42,880 | $10,500 | $32,380 |
Source: Public Records
Map
Nearby Homes
- 1013 S Heincke Rd
- 811 Moon Ct
- 1035 Woods View Ct
- 727 Harnam Ct
- 902 Althea Dr
- 807 Dunaway St
- 1045 S Linden Ave
- 1331 Cherry Hill Dr
- 1808 Burnside Dr
- 766 Dunaway St
- 1539 Commons Dr Unit 1539
- 615 Burnside Dr
- 1786 Ashley Dr
- 1734 Rosina Dr
- 230 Floyd Ave
- 233 Woodridge Dr
- 1131 Castleton Ct
- 1826 Ashley Dr
- 1132 Nouvelle Dr
- 460 S 8th St