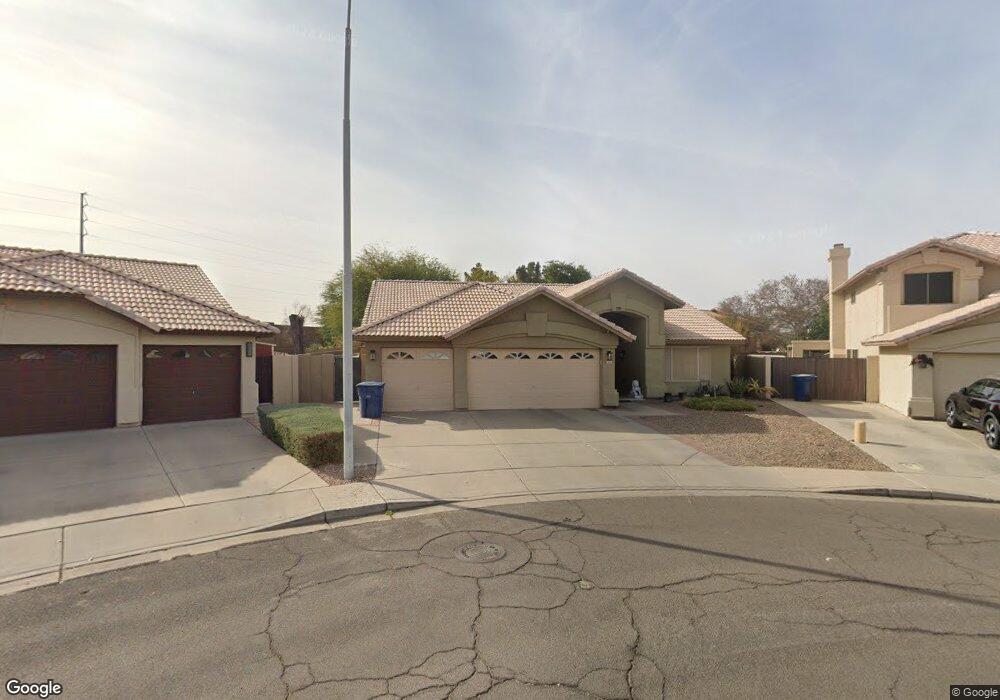
842 S Tangerine Dr Chandler, AZ 85226
West Chandler NeighborhoodEstimated Value: $537,701 - $587,000
4
Beds
2
Baths
1,972
Sq Ft
$288/Sq Ft
Est. Value
About This Home
This home is located at 842 S Tangerine Dr, Chandler, AZ 85226 and is currently estimated at $568,675, approximately $288 per square foot. 842 S Tangerine Dr is a home located in Maricopa County with nearby schools including Kyrene de la Paloma School, Kyrene del Pueblo Middle School, and Corona Del Sol High School.
Ownership History
Date
Name
Owned For
Owner Type
Purchase Details
Closed on
Sep 24, 2003
Sold by
Gatlin Thomas L and Gatlin Janelle C
Bought by
Le Phuong Huu and Do Quyen Le
Current Estimated Value
Home Financials for this Owner
Home Financials are based on the most recent Mortgage that was taken out on this home.
Original Mortgage
$162,400
Outstanding Balance
$74,975
Interest Rate
6.17%
Mortgage Type
New Conventional
Estimated Equity
$493,700
Purchase Details
Closed on
Jul 12, 2001
Sold by
Gatlin Tommy L
Bought by
Gatlin Thomas L and Gatlin Janelle C
Home Financials for this Owner
Home Financials are based on the most recent Mortgage that was taken out on this home.
Original Mortgage
$140,000
Interest Rate
7.15%
Purchase Details
Closed on
Sep 14, 1999
Sold by
Gatlin Beverly N
Bought by
Gatlin Tommy L
Create a Home Valuation Report for This Property
The Home Valuation Report is an in-depth analysis detailing your home's value as well as a comparison with similar homes in the area
Home Values in the Area
Average Home Value in this Area
Purchase History
| Date | Buyer | Sale Price | Title Company |
|---|---|---|---|
| Le Phuong Huu | $203,000 | First American Title Ins Co | |
| Gatlin Thomas L | -- | First American Title | |
| Gatlin Tommy L | -- | Security Title Agency | |
| Gatlin Tommy L | $176,000 | Security Title Agency |
Source: Public Records
Mortgage History
| Date | Status | Borrower | Loan Amount |
|---|---|---|---|
| Open | Le Phuong Huu | $162,400 | |
| Previous Owner | Gatlin Thomas L | $140,000 |
Source: Public Records
Tax History Compared to Growth
Tax History
| Year | Tax Paid | Tax Assessment Tax Assessment Total Assessment is a certain percentage of the fair market value that is determined by local assessors to be the total taxable value of land and additions on the property. | Land | Improvement |
|---|---|---|---|---|
| 2025 | $2,421 | $30,393 | -- | -- |
| 2024 | $2,316 | $28,946 | -- | -- |
| 2023 | $2,316 | $43,850 | $8,770 | $35,080 |
| 2022 | $2,204 | $33,420 | $6,680 | $26,740 |
| 2021 | $2,324 | $31,810 | $6,360 | $25,450 |
| 2020 | $2,271 | $30,010 | $6,000 | $24,010 |
| 2019 | $2,205 | $29,030 | $5,800 | $23,230 |
| 2018 | $2,132 | $27,630 | $5,520 | $22,110 |
| 2017 | $2,032 | $26,950 | $5,390 | $21,560 |
| 2016 | $2,074 | $25,680 | $5,130 | $20,550 |
| 2015 | $1,914 | $24,130 | $4,820 | $19,310 |
Source: Public Records
Map
Nearby Homes
- 5041 W Kesler Ln
- 5043 W Whitten St
- 4790 W Geronimo St
- 5330 W Kesler Ln
- 4650 W Geronimo St
- 5361 W Saragosa St
- 4918 W Chicago St
- 840 S Pineview Dr
- 5137 W Jupiter Way
- 4624 W Chicago St
- 4613 W Chicago St Unit 2
- 5580 W Kesler St
- 4612 W Jupiter Way
- 5143 W Mercury Way
- 4628 W Buffalo St
- 5151 W Glenview Place
- 5455 W Buffalo St
- 255 S Kyrene Rd Unit 231
- 255 S Kyrene Rd Unit 111
- 295 N Rural Rd Unit 160
- 4953 W Kesler Ln
- 832 S Tangerine Dr
- 851 S Twelve Oaks Blvd
- 841 S Twelve Oaks Blvd
- 5011 W Kesler Ln
- 4943 W Kesler Ln
- 822 S Tangerine Dr
- 831 S Twelve Oaks Blvd
- 4942 W Kesler Ln
- 4933 W Kesler Ln
- 812 S Tangerine Dr
- 821 S Twelve Oaks Blvd
- 5021 W Kesler Ln
- 4932 W Kesler Ln
- 811 S Twelve Oaks Blvd
- 5031 W Kesler Ln
- 4923 W Kesler Ln Unit 1
- 5032 W Kesler Ln
- 802 S Tangerine Dr
- 4941 W Geronimo St