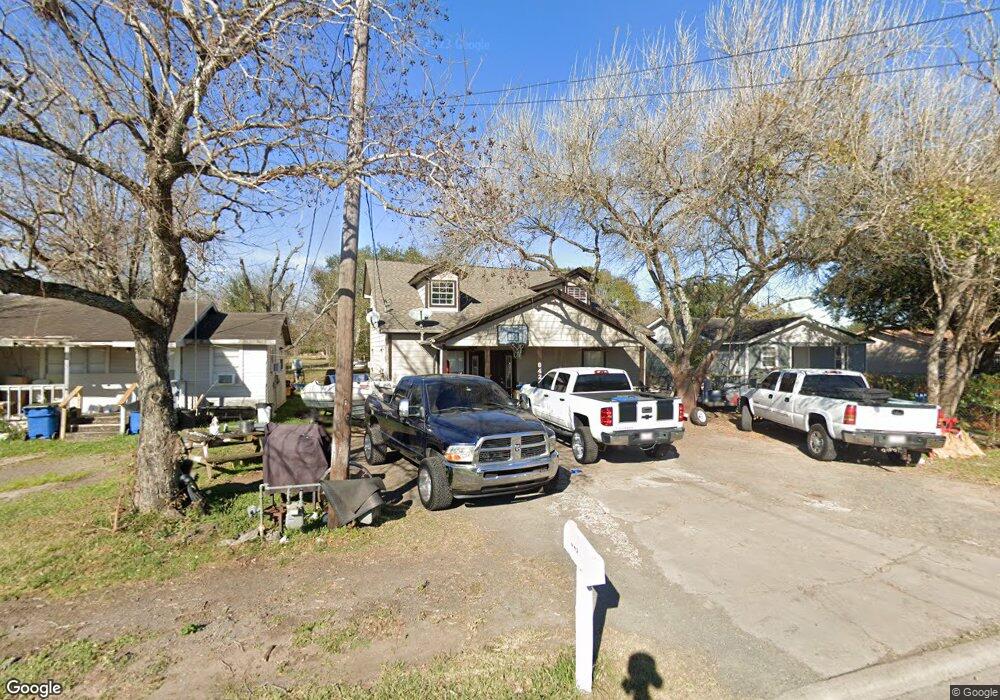
842 Vera Cruz Dr Rosenberg, TX 77471
Estimated Value: $211,000 - $262,000
3
Beds
2
Baths
2,033
Sq Ft
$116/Sq Ft
Est. Value
About This Home
This home is located at 842 Vera Cruz Dr, Rosenberg, TX 77471 and is currently estimated at $236,287, approximately $116 per square foot. 842 Vera Cruz Dr is a home located in Fort Bend County with nearby schools including Bowie Elementary School, Navarro Middle School, and George Junior High School.
Ownership History
Date
Name
Owned For
Owner Type
Purchase Details
Closed on
Mar 3, 2017
Sold by
Vasquez Candeiario T and Vasquez Amelia
Bought by
Bentancur Angle
Current Estimated Value
Home Financials for this Owner
Home Financials are based on the most recent Mortgage that was taken out on this home.
Original Mortgage
$90,000
Interest Rate
3.83%
Mortgage Type
Stand Alone First
Purchase Details
Closed on
Oct 22, 2004
Sold by
Vasquez Candelario T and Vasquez Amelia
Bought by
Bentancur Angie
Purchase Details
Closed on
Oct 19, 2001
Sold by
Arreguin Jose and Arreguin Guadalupe
Bought by
Bentancur Angie
Home Financials for this Owner
Home Financials are based on the most recent Mortgage that was taken out on this home.
Original Mortgage
$7,500
Interest Rate
6.85%
Mortgage Type
Seller Take Back
Create a Home Valuation Report for This Property
The Home Valuation Report is an in-depth analysis detailing your home's value as well as a comparison with similar homes in the area
Home Values in the Area
Average Home Value in this Area
Purchase History
| Date | Buyer | Sale Price | Title Company |
|---|---|---|---|
| Bentancur Angle | -- | Vantage Point Title | |
| Bentancur Angie | -- | Fidelity National Title | |
| Bentancur Angie | -- | -- |
Source: Public Records
Mortgage History
| Date | Status | Borrower | Loan Amount |
|---|---|---|---|
| Previous Owner | Bentancur Angle | $90,000 | |
| Previous Owner | Bentancur Angie | $7,500 |
Source: Public Records
Tax History Compared to Growth
Tax History
| Year | Tax Paid | Tax Assessment Tax Assessment Total Assessment is a certain percentage of the fair market value that is determined by local assessors to be the total taxable value of land and additions on the property. | Land | Improvement |
|---|---|---|---|---|
| 2025 | $1,202 | $148,459 | $14,923 | $149,712 |
| 2024 | $1,202 | $134,963 | -- | $154,695 |
| 2023 | $1,028 | $122,694 | $0 | $156,810 |
| 2022 | $1,608 | $111,540 | $0 | $142,680 |
| 2021 | $2,104 | $101,400 | $14,920 | $86,480 |
| 2020 | $2,165 | $102,020 | $14,920 | $87,100 |
| 2019 | $2,299 | $100,660 | $14,920 | $85,740 |
| 2018 | $2,238 | $96,420 | $14,920 | $81,500 |
| 2017 | $2,183 | $93,510 | $14,920 | $78,590 |
| 2016 | $2,201 | $94,280 | $14,920 | $79,360 |
| 2015 | $1,765 | $95,000 | $14,920 | $80,080 |
| 2014 | $1,916 | $94,430 | $14,920 | $79,510 |
Source: Public Records
Map
Nearby Homes
- 802 Matamoros Dr
- 1015 Santa fe Ct
- 2511 Spur 529
- 206 Timothy Trail
- 217 Timothy Trail
- 903 Brooks Ave
- 000 Bamore Rd
- 0 Muegge Rd Unit 43223201
- 805 Avenue J
- 3326 Tilley Dr
- 1108 Easy St
- 1112 James St
- 1208 Klare Ave
- 1126 Brooks Ave
- 00 Brooks Ave
- 804 Grunwald Heights Blvd
- 1301 Southgate Dr
- 1400 Dyer Ave
- 1613 Mulcahy St
- 111 Klauke Rd
- 902 Vera Cruz Dr
- 838 Vera Cruz Dr
- 834 Vera Cruz Dr
- 523 Seabourne Meadows Dr
- 523 Seaborne Meadow Dr
- 519 Seaborne Meadow Dr
- 310 Prairie Ln
- 511 Seabourne Meadows Dr
- 511 Seaborne Meadow Dr
- 603 Seaborne Meadow Dr
- 839 Vera Cruz Dr
- 230 Prairie Ln
- 901 Vera Cruz Dr
- 837 Vera Cruz Dr
- 822 Vera Cruz Dr
- 835 Vera Cruz Dr
- 507 Seaborne Meadow Dr
- 507 Seabourne Meadow Dr
- 607 Seaborne Meadow Dr
- 831 Vera Cruz Dr