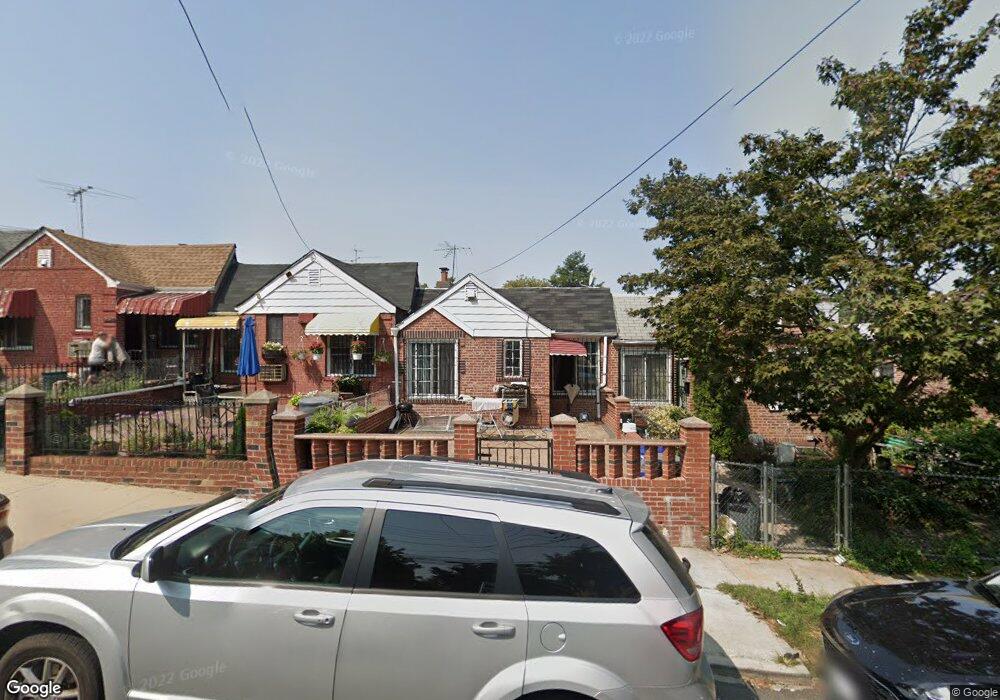
8421 57th Rd Elmhurst, NY 11373
Maspeth NeighborhoodEstimated Value: $805,000 - $913,000
--
Bed
--
Bath
893
Sq Ft
$950/Sq Ft
Est. Value
About This Home
This home is located at 8421 57th Rd, Elmhurst, NY 11373 and is currently estimated at $847,997, approximately $949 per square foot. 8421 57th Rd is a home located in Queens County with nearby schools including Ps 58 School Of Heroes, IS 73 - The Frank Sansivieri School, and Newtown High School.
Ownership History
Date
Name
Owned For
Owner Type
Purchase Details
Closed on
Sep 6, 2005
Sold by
Yan Jun Hui
Bought by
Serchan Krist and Serchan Shova Rai
Current Estimated Value
Home Financials for this Owner
Home Financials are based on the most recent Mortgage that was taken out on this home.
Original Mortgage
$300,000
Outstanding Balance
$159,225
Interest Rate
5.92%
Mortgage Type
Purchase Money Mortgage
Estimated Equity
$688,772
Purchase Details
Closed on
Aug 22, 2000
Sold by
Thompson Richard L
Bought by
Yan Jun Hui
Home Financials for this Owner
Home Financials are based on the most recent Mortgage that was taken out on this home.
Original Mortgage
$90,000
Interest Rate
8.07%
Purchase Details
Closed on
Aug 6, 1999
Sold by
Thomson Helen Cunningham and Cunningham Helen M
Bought by
Thomson Richard L and Thomson Helen Cunningham
Create a Home Valuation Report for This Property
The Home Valuation Report is an in-depth analysis detailing your home's value as well as a comparison with similar homes in the area
Home Values in the Area
Average Home Value in this Area
Purchase History
| Date | Buyer | Sale Price | Title Company |
|---|---|---|---|
| Serchan Krist | $465,000 | -- | |
| Serchan Krist | $465,000 | -- | |
| Yan Jun Hui | $216,000 | -- | |
| Yan Jun Hui | $216,000 | -- | |
| Thomson Richard L | -- | First American Title Ins Co | |
| Thomson Richard L | -- | First American Title Ins Co |
Source: Public Records
Mortgage History
| Date | Status | Borrower | Loan Amount |
|---|---|---|---|
| Open | Serchan Krist | $300,000 | |
| Closed | Serchan Krist | $300,000 | |
| Previous Owner | Yan Jun Hui | $90,000 |
Source: Public Records
Tax History Compared to Growth
Tax History
| Year | Tax Paid | Tax Assessment Tax Assessment Total Assessment is a certain percentage of the fair market value that is determined by local assessors to be the total taxable value of land and additions on the property. | Land | Improvement |
|---|---|---|---|---|
| 2025 | $7,136 | $37,118 | $10,795 | $26,323 |
| 2024 | $7,136 | $35,528 | $10,731 | $24,797 |
| 2023 | $6,732 | $33,518 | $10,688 | $22,830 |
| 2022 | $6,313 | $46,320 | $14,100 | $32,220 |
| 2021 | $6,514 | $48,720 | $14,100 | $34,620 |
| 2020 | $6,547 | $41,880 | $14,100 | $27,780 |
| 2019 | $6,194 | $35,880 | $14,100 | $21,780 |
| 2018 | $5,694 | $27,932 | $9,390 | $18,542 |
| 2017 | $5,372 | $26,352 | $9,877 | $16,475 |
| 2016 | $5,157 | $26,352 | $9,877 | $16,475 |
| 2015 | $2,998 | $25,777 | $12,356 | $13,421 |
| 2014 | $2,998 | $24,673 | $14,198 | $10,475 |
Source: Public Records
Map
Nearby Homes
- 84-24 57th Rd
- 8318 58th Ave
- 5810 83rd Place
- 85-30 57th Ave Unit 1A
- 8230 58th Ave
- 85-21 56th Ave
- 5434 83rd St
- 58-25 83rd St
- 84-26 60th Ave
- 58-05 Van Horn St
- 8426 60th Ave
- 86-20 57th Rd
- 57-57 81st St
- 52-57 84th St
- 8621 59th Ave
- 8638 57th Ave
- 8703 57th Rd Unit 41
- 86-16 60th Ave Unit 4L
- 86-16 60th Ave Unit 2N
- 86-16 60th Ave Unit 2B