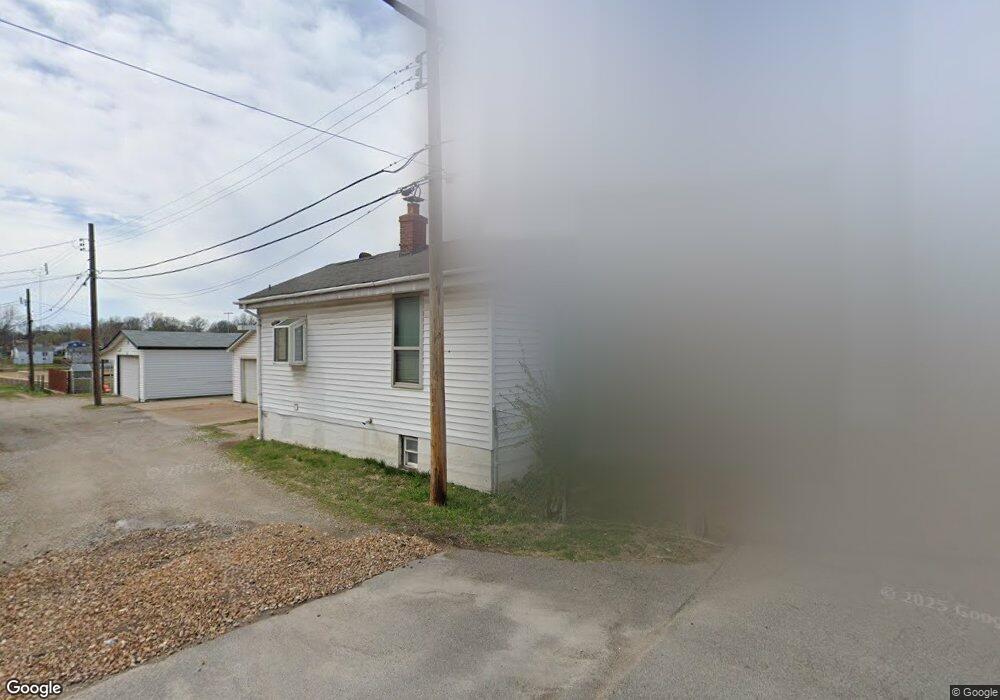
8422 Tennessee Ave Saint Louis, MO 63125
Lemay NeighborhoodEstimated Value: $95,000 - $158,265
2
Beds
2
Baths
1,187
Sq Ft
$105/Sq Ft
Est. Value
About This Home
This home is located at 8422 Tennessee Ave, Saint Louis, MO 63125 and is currently estimated at $124,816, approximately $105 per square foot. 8422 Tennessee Ave is a home located in St. Louis County with nearby schools including Hancock Place Elementary School, Hancock Place Middle School, and Hancock Place High School.
Ownership History
Date
Name
Owned For
Owner Type
Purchase Details
Closed on
Aug 4, 2011
Sold by
Federal Home Loan Mortgage Corporation
Bought by
Music Alen
Current Estimated Value
Home Financials for this Owner
Home Financials are based on the most recent Mortgage that was taken out on this home.
Original Mortgage
$43,761
Interest Rate
4.5%
Mortgage Type
FHA
Purchase Details
Closed on
May 6, 2011
Sold by
Lavine Jeanette L and Lavine Richard T
Bought by
Federal Home Loan Mortgage Corporation
Purchase Details
Closed on
Oct 29, 2008
Sold by
Citimortgage Inc
Bought by
Freed Alex
Purchase Details
Closed on
Sep 22, 2008
Sold by
Ford Mary
Bought by
Citimortgage Inc
Purchase Details
Closed on
Jun 3, 1999
Sold by
Becker Gerald A and Becker Verla C
Bought by
Lavine Richard T and Lavine Jeanette L
Home Financials for this Owner
Home Financials are based on the most recent Mortgage that was taken out on this home.
Original Mortgage
$69,328
Interest Rate
6.92%
Mortgage Type
FHA
Create a Home Valuation Report for This Property
The Home Valuation Report is an in-depth analysis detailing your home's value as well as a comparison with similar homes in the area
Home Values in the Area
Average Home Value in this Area
Purchase History
| Date | Buyer | Sale Price | Title Company |
|---|---|---|---|
| Music Alen | $44,900 | Stewart Title | |
| Federal Home Loan Mortgage Corporation | $58,500 | None Available | |
| Freed Alex | $29,000 | U S Title | |
| Citimortgage Inc | $36,500 | None Available | |
| Lavine Richard T | $69,900 | -- |
Source: Public Records
Mortgage History
| Date | Status | Borrower | Loan Amount |
|---|---|---|---|
| Previous Owner | Music Alen | $43,761 | |
| Previous Owner | Lavine Richard T | $69,328 | |
| Closed | Citimortgage Inc | -- |
Source: Public Records
Tax History Compared to Growth
Tax History
| Year | Tax Paid | Tax Assessment Tax Assessment Total Assessment is a certain percentage of the fair market value that is determined by local assessors to be the total taxable value of land and additions on the property. | Land | Improvement |
|---|---|---|---|---|
| 2025 | $2,121 | $29,470 | $7,110 | $22,360 |
| 2024 | $2,121 | $27,360 | $3,630 | $23,730 |
| 2023 | $2,014 | $27,360 | $3,630 | $23,730 |
| 2022 | $1,604 | $19,680 | $4,100 | $15,580 |
| 2021 | $1,576 | $19,680 | $4,100 | $15,580 |
| 2020 | $1,563 | $18,640 | $4,100 | $14,540 |
| 2019 | $1,559 | $18,640 | $4,100 | $14,540 |
| 2018 | $1,457 | $15,180 | $3,630 | $11,550 |
| 2017 | $1,432 | $15,180 | $3,630 | $11,550 |
| 2016 | $1,284 | $13,090 | $1,580 | $11,510 |
| 2015 | $1,277 | $13,090 | $1,580 | $11,510 |
| 2014 | $1,055 | $11,440 | $1,430 | $10,010 |
Source: Public Records
Map
Nearby Homes
- 8439 Tennessee Ave
- 8523 Idaho Ave
- 8626 Shoss Ave
- 3708 Comstock Dr
- 3720 Comstock Dr
- 235 Military Rd
- 252 Wachtel Ave
- 241 Dammert Ave
- 324 Hurck St
- 622 Kayser Ave
- 8309 Minnesota Ave
- 610 Kayser Ave
- 300 Kayser Ave
- 212 Espenschied St
- 7709 Vermont Ave
- 3651 Germania St
- 302 Waller Ave
- 514 E Dallas Ct
- 3619 Steins St
- 8213 S Broadway
- 8422 Tennessee Ave Unit R
- 8422 Tennessee Ave Unit Rear
- 8426 Tennessee Ave
- 8409 Alaska Ave
- 8418 Tennessee Ave
- 8428 Tennessee Ave
- 8407 Alaska Ave
- 8417 Alaska Ave
- 8430 Tennessee Ave
- 8415 Alaska Ave
- 8416 Tennessee Ave
- 8403 Alaska Ave
- 8419 Alaska Ave
- 8421 Alaska Ave
- 8412 Tennessee Ave
- 8401 Alaska Ave
- 8410 Tennessee Ave
- 313 River City Blvd
- 8423 Alaska Ave
- 8431 Tennessee Ave