8423 236th St SW Unit B Edmonds, WA 98026
Chase Lake NeighborhoodEstimated Value: $625,000 - $775,000
2
Beds
2
Baths
1,757
Sq Ft
$384/Sq Ft
Est. Value
About This Home
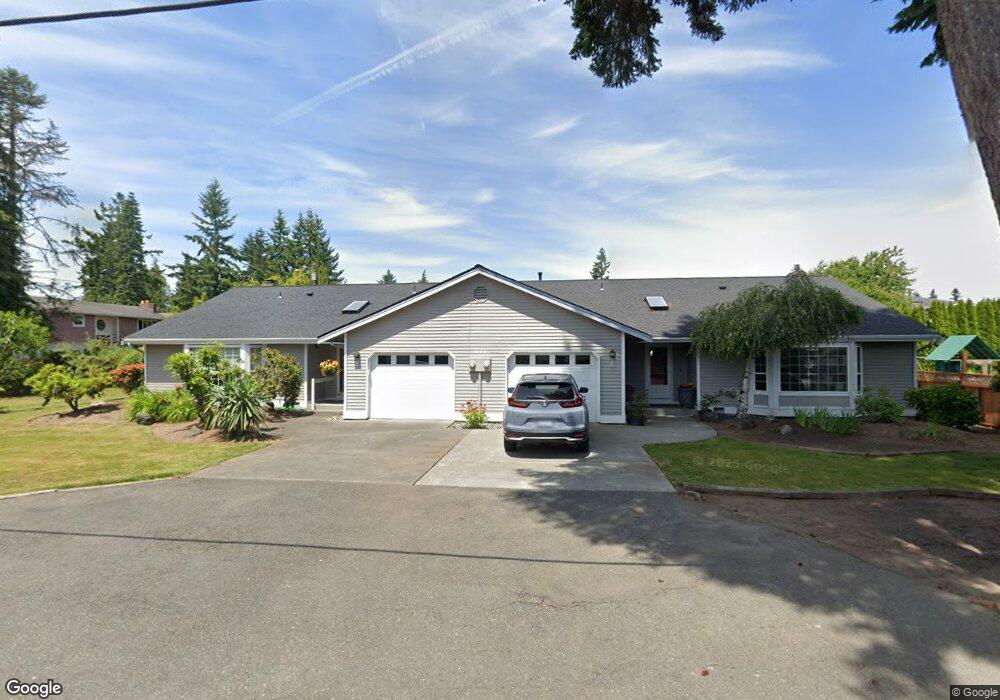
This home is located at 8423 236th St SW Unit B, Edmonds, WA 98026 and is currently estimated at $674,576, approximately $383 per square foot. 8423 236th St SW Unit B is a home located in Snohomish County with nearby schools including Sherwood Elementary School, College Place Middle School, and Edmonds-Woodway High School.
Ownership History
Date
Name
Owned For
Owner Type
Purchase Details
Closed on
Jul 27, 2018
Sold by
Moore Debra Ann
Bought by
Moore Michael K
Current Estimated Value
Purchase Details
Closed on
Jul 26, 2018
Sold by
Ray Meadows Llc
Bought by
Moore Debra Ann
Purchase Details
Closed on
Feb 23, 2015
Sold by
Phelps Russell G
Bought by
Ray Meadows Llc
Purchase Details
Closed on
Feb 5, 2005
Sold by
Whitney Bette D
Bought by
Phelps Russell G
Home Financials for this Owner
Home Financials are based on the most recent Mortgage that was taken out on this home.
Original Mortgage
$199,000
Interest Rate
6.12%
Mortgage Type
Unknown
Purchase Details
Closed on
May 19, 1995
Sold by
Granados Gladys I
Bought by
Whitney Bette D and Whitney Lois R
Create a Home Valuation Report for This Property
The Home Valuation Report is an in-depth analysis detailing your home's value as well as a comparison with similar homes in the area
Home Values in the Area
Average Home Value in this Area
Purchase History
| Date | Buyer | Sale Price | Title Company |
|---|---|---|---|
| Moore Michael K | -- | None Available | |
| Moore Debra Ann | -- | None Available | |
| Moore Michael K | -- | None Available | |
| Ray Meadows Llc | $295,000 | Cw Title | |
| Phelps Russell G | $274,000 | Chicago Title | |
| Whitney Bette D | $139,950 | -- |
Source: Public Records
Mortgage History
| Date | Status | Borrower | Loan Amount |
|---|---|---|---|
| Previous Owner | Phelps Russell G | $199,000 |
Source: Public Records
Tax History Compared to Growth
Tax History
| Year | Tax Paid | Tax Assessment Tax Assessment Total Assessment is a certain percentage of the fair market value that is determined by local assessors to be the total taxable value of land and additions on the property. | Land | Improvement |
|---|---|---|---|---|
| 2025 | $4,234 | $615,500 | $228,500 | $387,000 |
| 2024 | $4,234 | $599,500 | $222,500 | $377,000 |
| 2023 | $3,838 | $563,000 | $208,500 | $354,500 |
| 2022 | $3,990 | $481,500 | $176,000 | $305,500 |
| 2020 | $4,345 | $467,500 | $168,000 | $299,500 |
| 2019 | $4,103 | $445,000 | $152,500 | $292,500 |
| 2018 | $4,007 | $375,500 | $115,500 | $260,000 |
| 2017 | $3,235 | $317,500 | $103,000 | $214,500 |
| 2016 | $2,790 | $271,500 | $103,000 | $168,500 |
| 2015 | $2,429 | $222,500 | $86,500 | $136,000 |
| 2013 | $1,943 | $168,000 | $86,500 | $81,500 |
Source: Public Records
Map
Nearby Homes
- 8614 Madrona Ln
- 8615 238th St SW Unit B101
- 23601 Edmonds Way
- 23727 80th Ct W
- 8017 234th St SW Unit 325
- 8517 242nd St SW Unit 402
- 23116 80th Place W
- 8825 231st Place SW
- 7907 240th St SW
- 7901 240th St SW
- 23227 92nd Ave W
- 23121 Edmonds Way Unit 2
- 8515 244th St SW Unit A2
- 8603 244th St SW Unit 2D
- 22910 90th Ave W Unit C306
- 23015 Edmonds Way Unit A103
- 7914 242nd St SW
- 20314 N Park Ave N
- 7818 228th St SW Unit 106
- 23511 96th Ave W
- 8423 236th St SW Unit A
- 23518 84th Ave W
- 8505 236th St SW
- 23516 84th Ave W
- 23520 85th Ave W
- 23522 84th Ave W
- 8420 236th St SW
- 8426 236th St SW
- 8414 236th St SW
- 8432 236th St SW
- 23512 85th Ave W
- 23514 84th Ave W
- 8423 235th Place SW
- 8408 236th St SW
- 8415 235th Place SW
- 8515 236th St SW
- 23605 86th Ave W
- 8504 236th St SW
- 23506 85th Ave W
- 23504 84th Ave W