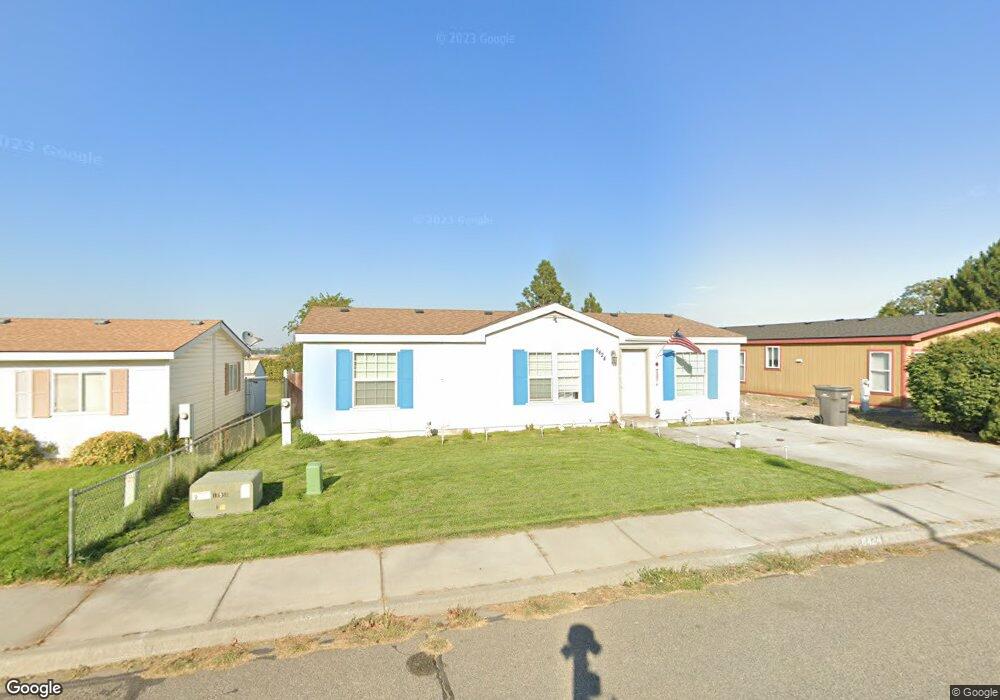
8424 W Canyon Ave Kennewick, WA 99336
Estimated Value: $284,000 - $326,000
--
Bed
--
Bath
1,232
Sq Ft
$246/Sq Ft
Est. Value
About This Home
This home is located at 8424 W Canyon Ave, Kennewick, WA 99336 and is currently estimated at $303,105, approximately $246 per square foot. 8424 W Canyon Ave is a home with nearby schools including Vista Elementary School, Desert Hills Middle School, and Kamiakin High School.
Ownership History
Date
Name
Owned For
Owner Type
Purchase Details
Closed on
Dec 3, 2019
Sold by
Penick Lee R and Penick Anna
Bought by
Drye Jodi Rae and Warde John A
Current Estimated Value
Home Financials for this Owner
Home Financials are based on the most recent Mortgage that was taken out on this home.
Original Mortgage
$185,576
Outstanding Balance
$166,372
Interest Rate
4.5%
Mortgage Type
FHA
Estimated Equity
$136,733
Purchase Details
Closed on
Dec 18, 2015
Sold by
Wells Fargo Bank Na
Bought by
Penick Lee R
Purchase Details
Closed on
Aug 31, 2015
Sold by
Rodriguez Adrian M and Brandt Amanda A
Bought by
Wells Fargo Bank Na
Purchase Details
Closed on
Apr 17, 2007
Sold by
Crume Bryan P and Crume Bonnie F
Bought by
Rodriguez Adrian M and Brandt Amanda A
Home Financials for this Owner
Home Financials are based on the most recent Mortgage that was taken out on this home.
Original Mortgage
$105,346
Interest Rate
6.11%
Mortgage Type
Purchase Money Mortgage
Create a Home Valuation Report for This Property
The Home Valuation Report is an in-depth analysis detailing your home's value as well as a comparison with similar homes in the area
Home Values in the Area
Average Home Value in this Area
Purchase History
| Date | Buyer | Sale Price | Title Company |
|---|---|---|---|
| Drye Jodi Rae | $219,882 | First American Title Ins Co | |
| Penick Lee R | $89,270 | Tri City Title & Escrow | |
| Wells Fargo Bank Na | $89,270 | None Available | |
| Rodriguez Adrian M | $107,000 | Cascade Title |
Source: Public Records
Mortgage History
| Date | Status | Borrower | Loan Amount |
|---|---|---|---|
| Open | Drye Jodi Rae | $185,576 | |
| Previous Owner | Rodriguez Adrian M | $105,346 |
Source: Public Records
Tax History Compared to Growth
Tax History
| Year | Tax Paid | Tax Assessment Tax Assessment Total Assessment is a certain percentage of the fair market value that is determined by local assessors to be the total taxable value of land and additions on the property. | Land | Improvement |
|---|---|---|---|---|
| 2024 | $1,609 | $198,370 | $70,000 | $128,370 |
| 2023 | $1,609 | $198,370 | $70,000 | $128,370 |
| 2022 | $1,486 | $166,280 | $70,000 | $96,280 |
| 2021 | $1,446 | $150,230 | $70,000 | $80,230 |
| 2020 | $1,434 | $141,780 | $31,500 | $110,280 |
| 2019 | $1,076 | $134,670 | $31,500 | $103,170 |
| 2018 | $1,308 | $102,650 | $31,500 | $71,150 |
| 2017 | $1,191 | $102,650 | $31,500 | $71,150 |
| 2016 | $999 | $102,650 | $31,500 | $71,150 |
| 2015 | $1,549 | $102,650 | $31,500 | $71,150 |
| 2014 | -- | $97,980 | $27,000 | $70,980 |
| 2013 | -- | $97,980 | $27,000 | $70,980 |
Source: Public Records
Map
Nearby Homes
- 8530 W Arrowhead Ave
- 8516 W Gage Blvd
- 0 Tapteal Dr
- 2101 N Pittsburg Ct
- 2327 N Rhode Island St
- 2467 N Rhode Island Ct
- 2105 N Steptoe St Unit 119
- 8906 W Rio Grande Ave
- 9139 W Arrowhead Ave
- 1336 Florida Ave
- 1302 N Montana St
- 1353 Carolina Ave
- 2307 Franz Ct
- 1641 Foxglove Ave
- 905 N Pittsburg St
- 560 Wisteria St
- 1606 Lantana Ave
- 2404 Mark Ave
- 1645 Lantana Ave
- 1593 Lantana Ave
- 8418 W Canyon Ave
- 8430 W Canyon Ave
- 8406 W Canyon Ave
- 8436 W Canyon Ave
- 8427 W Canyon Ave
- 8421 W Canyon Ave
- 8415 W Canyon Ave
- 8400 W Canyon Ave
- 8500 W Canyon Ave
- 8433 W Canyon Ave
- 8433 W Canyon Ave Unit Great Home & Shop! E
- 8409 W Canyon Ave
- 8409 W Canyon Ave Unit Central to everythin
- 8501 W Canyon Ave
- 8336 W Canyon Ave
- 8507 W Canyon Ave
- 8506 W Canyon Ave
- 2112 N Louisiana Ct
- 2112 N Louisiana Ct Unit OVER-SIZED GARAGE &
- 8402 W Yellowstone Ave