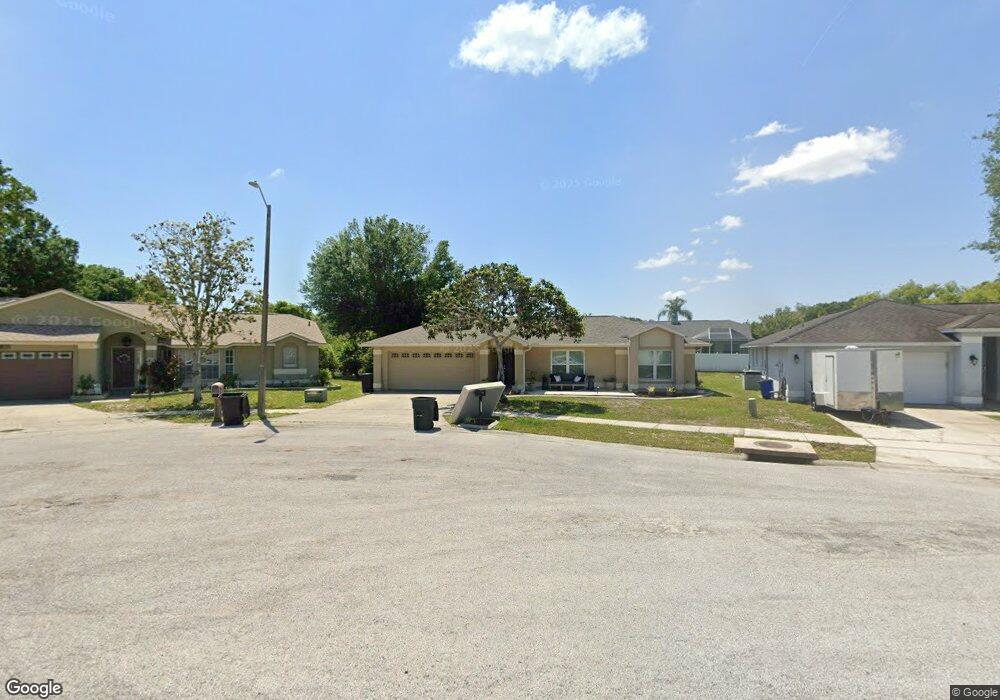
8426 Picnic Ct New Port Richey, FL 34653
South New Port Richey NeighborhoodEstimated Value: $316,399 - $391,000
--
Bed
2
Baths
1,733
Sq Ft
$200/Sq Ft
Est. Value
About This Home
This home is located at 8426 Picnic Ct, New Port Richey, FL 34653 and is currently estimated at $345,850, approximately $199 per square foot. 8426 Picnic Ct is a home located in Pasco County with nearby schools including Deer Park Elementary School, River Ridge High School, and River Ridge Middle School.
Ownership History
Date
Name
Owned For
Owner Type
Purchase Details
Closed on
Oct 15, 2023
Sold by
Kitchens William D and Kitchens Crystal J
Bought by
Kitchens Crystal J
Current Estimated Value
Purchase Details
Closed on
Jun 29, 2018
Sold by
Boutwell John L
Bought by
Kitchens William D and Kitchens Crystal J
Home Financials for this Owner
Home Financials are based on the most recent Mortgage that was taken out on this home.
Original Mortgage
$140,500
Interest Rate
4.6%
Mortgage Type
New Conventional
Purchase Details
Closed on
Feb 14, 2006
Sold by
Craig Robert and Craig Donna M
Bought by
Boutwell John L
Home Financials for this Owner
Home Financials are based on the most recent Mortgage that was taken out on this home.
Original Mortgage
$104,500
Interest Rate
5%
Mortgage Type
Fannie Mae Freddie Mac
Create a Home Valuation Report for This Property
The Home Valuation Report is an in-depth analysis detailing your home's value as well as a comparison with similar homes in the area
Home Values in the Area
Average Home Value in this Area
Purchase History
| Date | Buyer | Sale Price | Title Company |
|---|---|---|---|
| Kitchens Crystal J | $100 | None Listed On Document | |
| Kitchens Crystal J | $100 | None Listed On Document | |
| Kitchens William D | $150,000 | Platinum National Title Llc | |
| Boutwell John L | $110,000 | Members Title Agency Llc |
Source: Public Records
Mortgage History
| Date | Status | Borrower | Loan Amount |
|---|---|---|---|
| Previous Owner | Kitchens William D | $140,500 | |
| Previous Owner | Boutwell John L | $104,500 |
Source: Public Records
Tax History Compared to Growth
Tax History
| Year | Tax Paid | Tax Assessment Tax Assessment Total Assessment is a certain percentage of the fair market value that is determined by local assessors to be the total taxable value of land and additions on the property. | Land | Improvement |
|---|---|---|---|---|
| 2025 | $2,650 | $192,910 | -- | -- |
| 2024 | $2,650 | $182,200 | -- | -- |
| 2023 | $2,547 | $176,900 | $0 | $0 |
| 2022 | $2,285 | $171,750 | $0 | $0 |
| 2021 | $2,237 | $166,750 | $29,073 | $137,677 |
| 2020 | $2,179 | $163,310 | $29,073 | $134,237 |
| 2019 | $2,137 | $159,640 | $29,073 | $130,567 |
| 2018 | $2,642 | $159,764 | $29,073 | $130,691 |
| 2017 | $2,447 | $142,494 | $29,073 | $113,421 |
| 2016 | $2,170 | $120,417 | $22,811 | $97,606 |
| 2015 | $2,036 | $110,031 | $22,811 | $87,220 |
| 2014 | $1,849 | $101,407 | $21,571 | $79,836 |
Source: Public Records
Map
Nearby Homes
- 8450 Royal Hart Dr
- 8461 Red Roe Dr
- 5310 Anhinga Trail
- 8346 Shallow Creek Ct
- 8349 Shallow Creek Ct
- 8447 Shallow Creek Ct
- 8513 Shallow Creek Ct
- 8546 Great Egret Trace
- 8122 Matthew Dr
- 8604 Great Egret Trace
- 4853 Crestknoll Ln
- 8612 Great Egret Trace
- 4731 Spring Side Dr
- 4644 Sawgrass Blvd
- 8704 Cypress Lakes Blvd
- 7902 Royal Hart Dr
- 8110 Damara Dr
- 7846 Royal Hart Dr
- 7838 Trail Run Loop
- 5036 Glenhurst Ln
- 8420 Picnic Ct
- 8432 Picnic Ct
- 8425 Yearling Ln
- 8431 Yearling Ln
- 8438 Picnic Ct
- 8417 Yearling Ln
- 8414 Picnic Ct
- 8437 Yearling Ln
- 8444 Picnic Ct
- 8409 Yearling Ln
- 8445 Yearling Ln
- 8406 Picnic Ct
- 5142 Spike Horn Dr
- 5148 Spike Horn Dr
- 5114 Spike Horn Dr
- 8453 Yearling Ln
- 8424 Yearling Ln
- 8430 Yearling Ln
- 8403 Yearling Ln
- 8416 Yearling Ln