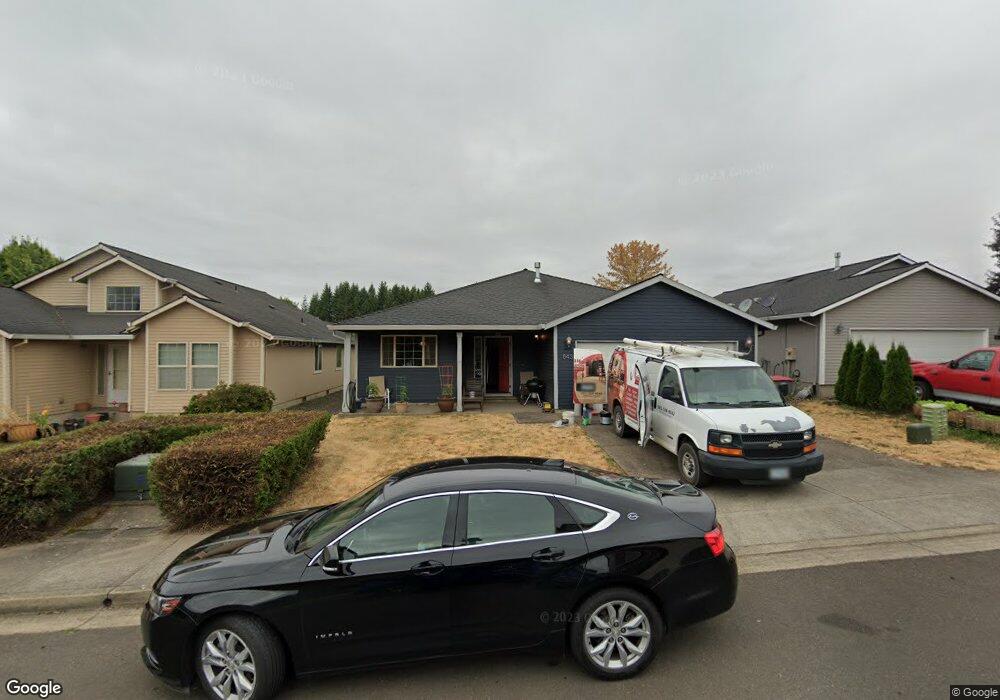
843 Grant St Lafayette, OR 97127
Lafayette NeighborhoodEstimated Value: $437,000 - $480,000
3
Beds
2
Baths
1,588
Sq Ft
$287/Sq Ft
Est. Value
About This Home
This home is located at 843 Grant St, Lafayette, OR 97127 and is currently estimated at $456,444, approximately $287 per square foot. 843 Grant St is a home located in Yamhill County with nearby schools including Wascher Elementary School, Patton Middle School, and McMinnville High School.
Ownership History
Date
Name
Owned For
Owner Type
Purchase Details
Closed on
May 5, 2021
Sold by
Dikeman Marvin L
Bought by
Britton Charles H and Britton Abigail S
Current Estimated Value
Home Financials for this Owner
Home Financials are based on the most recent Mortgage that was taken out on this home.
Original Mortgage
$268,000
Outstanding Balance
$241,840
Interest Rate
3.1%
Mortgage Type
New Conventional
Estimated Equity
$214,604
Purchase Details
Closed on
Dec 21, 2007
Sold by
Green Castle Llc
Bought by
Dikeman Marvin L
Home Financials for this Owner
Home Financials are based on the most recent Mortgage that was taken out on this home.
Original Mortgage
$21,700
Interest Rate
6.15%
Mortgage Type
Credit Line Revolving
Create a Home Valuation Report for This Property
The Home Valuation Report is an in-depth analysis detailing your home's value as well as a comparison with similar homes in the area
Home Values in the Area
Average Home Value in this Area
Purchase History
| Date | Buyer | Sale Price | Title Company |
|---|---|---|---|
| Britton Charles H | $335,000 | First American | |
| Dikeman Marvin L | $217,500 | Ticor Title Insurance Co | |
| Green Castle Llc | -- | Ticor Title Insurance Co |
Source: Public Records
Mortgage History
| Date | Status | Borrower | Loan Amount |
|---|---|---|---|
| Open | Britton Charles H | $268,000 | |
| Previous Owner | Green Castle Llc | $21,700 | |
| Previous Owner | Dikeman Marvin L | $174,000 |
Source: Public Records
Tax History Compared to Growth
Tax History
| Year | Tax Paid | Tax Assessment Tax Assessment Total Assessment is a certain percentage of the fair market value that is determined by local assessors to be the total taxable value of land and additions on the property. | Land | Improvement |
|---|---|---|---|---|
| 2025 | $2,869 | $195,817 | -- | -- |
| 2024 | $2,794 | $190,114 | -- | -- |
| 2023 | $2,720 | $184,577 | $0 | $0 |
| 2022 | $2,667 | $179,201 | $0 | $0 |
| 2021 | $2,582 | $173,982 | $0 | $0 |
| 2020 | $2,517 | $168,915 | $0 | $0 |
| 2019 | $2,460 | $163,995 | $0 | $0 |
| 2018 | $2,254 | $159,218 | $0 | $0 |
| 2017 | $2,191 | $154,581 | $0 | $0 |
| 2016 | $2,148 | $150,079 | $0 | $0 |
| 2015 | $2,085 | $145,709 | $0 | $0 |
| 2014 | $2,031 | $141,467 | $0 | $0 |
Source: Public Records
Map
Nearby Homes
- 1001 E 9th St
- 731 N Lincoln St
- 841 12th St
- 1026 E 15th St
- 1282 3rd St Unit 37
- 966 E 15th St
- 967 E 16th St
- 1167 N Madison St
- 13650 NE Stoller Rd
- 435 5th St
- 277 E 13th St
- 1720 N Chinook Ln
- 234 W 18th St
- 1333 Adams St
- 253 E 7th St
- 897 Washington St
- 4751 NE Henry Creek Rd
- 175 W 8th St
- 1173 Joels Place
- 195 W 8th St