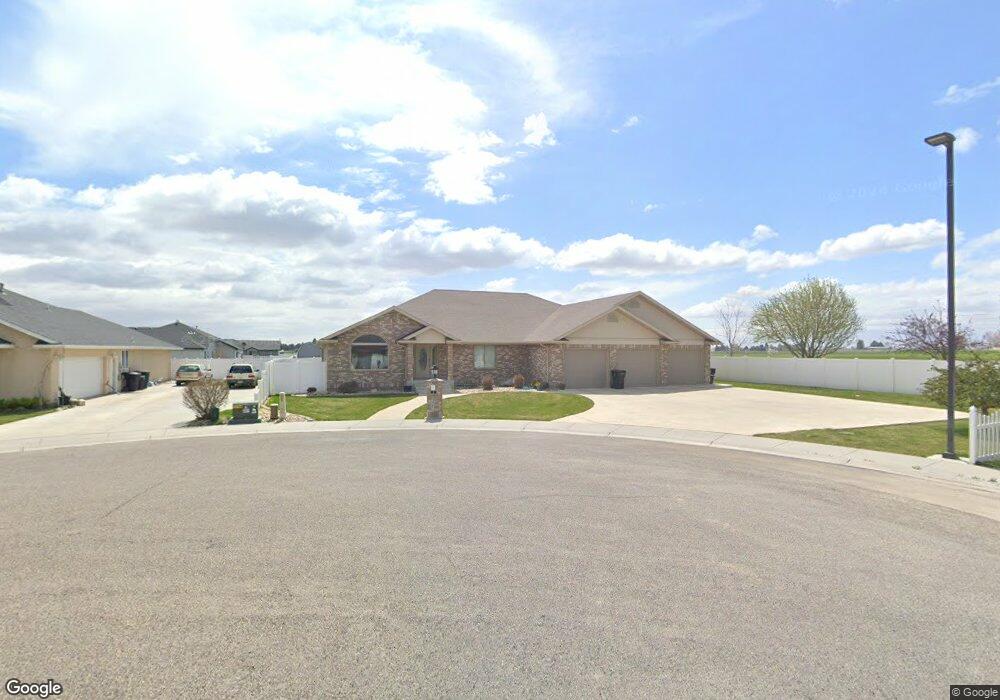
843 Howell Canyon Ct Burley, ID 83318
Estimated Value: $550,000 - $865,000
5
Beds
3
Baths
5,536
Sq Ft
$127/Sq Ft
Est. Value
About This Home
This home is located at 843 Howell Canyon Ct, Burley, ID 83318 and is currently estimated at $704,671, approximately $127 per square foot. 843 Howell Canyon Ct is a home located in Cassia County with nearby schools including Mountain View Elementary School, White Pine Elementary School, and Burley Junior High School.
Ownership History
Date
Name
Owned For
Owner Type
Purchase Details
Closed on
Jul 24, 2015
Sold by
Pickering Donald J and Pickering Marva
Bought by
Pickering Don J and Pickering Marva
Current Estimated Value
Home Financials for this Owner
Home Financials are based on the most recent Mortgage that was taken out on this home.
Original Mortgage
$197,000
Outstanding Balance
$76,665
Interest Rate
3.98%
Mortgage Type
New Conventional
Estimated Equity
$628,006
Purchase Details
Closed on
Jul 2, 2015
Sold by
Pickering Donald J and Pickering Marva
Bought by
Pickering Marva
Home Financials for this Owner
Home Financials are based on the most recent Mortgage that was taken out on this home.
Original Mortgage
$197,000
Outstanding Balance
$76,665
Interest Rate
3.98%
Mortgage Type
New Conventional
Estimated Equity
$628,006
Purchase Details
Closed on
Aug 9, 2007
Sold by
Pickering Marva
Bought by
Pickering Donald J and Pickering Marva
Purchase Details
Closed on
Jun 14, 2006
Sold by
Idaho Land Holdings Llc
Bought by
Pickering Donald J and Pickering Marva
Home Financials for this Owner
Home Financials are based on the most recent Mortgage that was taken out on this home.
Original Mortgage
$230,000
Interest Rate
6.55%
Mortgage Type
Future Advance Clause Open End Mortgage
Create a Home Valuation Report for This Property
The Home Valuation Report is an in-depth analysis detailing your home's value as well as a comparison with similar homes in the area
Home Values in the Area
Average Home Value in this Area
Purchase History
| Date | Buyer | Sale Price | Title Company |
|---|---|---|---|
| Pickering Don J | -- | Titleone | |
| Pickering Marva | -- | Titleone | |
| Pickering Donald J | -- | None Available | |
| Pickering Donald J | -- | Land Title & Escrow |
Source: Public Records
Mortgage History
| Date | Status | Borrower | Loan Amount |
|---|---|---|---|
| Open | Pickering Don J | $197,000 | |
| Previous Owner | Pickering Donald J | $230,000 |
Source: Public Records
Tax History Compared to Growth
Tax History
| Year | Tax Paid | Tax Assessment Tax Assessment Total Assessment is a certain percentage of the fair market value that is determined by local assessors to be the total taxable value of land and additions on the property. | Land | Improvement |
|---|---|---|---|---|
| 2024 | $3,155 | $643,944 | $80,000 | $563,944 |
| 2023 | $4,293 | $650,611 | $80,000 | $570,611 |
| 2022 | $4,742 | $582,875 | $78,185 | $504,690 |
| 2021 | $4,228 | $438,999 | $57,915 | $381,084 |
| 2020 | $4,764 | $423,409 | $42,325 | $381,084 |
| 2019 | $4,620 | $409,917 | $39,930 | $369,987 |
| 2017 | $4,197 | $371,621 | $36,300 | $335,321 |
| 2016 | $4,099 | $361,854 | $36,300 | $325,554 |
| 2015 | $4,133 | $358,554 | $33,000 | $325,554 |
| 2014 | $4,196 | $358,554 | $33,000 | $325,554 |
| 2013 | $4,196 | $358,554 | $33,000 | $325,554 |
Source: Public Records
Map
Nearby Homes
- 2726 Fairmont Dr
- 262 Ferdinand Cir
- 731 Clear Springs St
- 431 Pratt Place
- 2593 Burton Ave
- 628 W 24th St
- 590 W 24th St
- 2960 Mcbride Place
- 2435 Oakley Ave Unit Burley, ID
- 301 E 27th St
- 2140 Daven Place
- 519 Lake Cleveland St
- 160 S 100 W
- 1942 Burton Ave
- 320 E 23rd Dr
- 2441 Dorchester Ave
- 215 S Hills St
- 91 W 200 S
- 201 W 19th St
- 600 Oxford St
- 829 Howell Canyon Ct
- 842 Howell Canyon Ct
- 815 Howell Canyon Ct
- 2620 Lake Cleveland St
- TBD Lake Cleveland St
- 2754 Mount Harrison Dr
- 2842 Mount Harrison Dr
- 801 Howell Canyon Ct
- 835 Lake Cleveland St
- 2829 Mount Harrison Dr
- 2843 Mount Harrison Dr
- 2801 Mount Harrison Dr
- 2740 Mt Harrison Dr
- 827 Lake Cleveland St
- 2702 Mount Harrison Dr
- 2743 Mt Harrison Dr
- 2757 Mount Harrison Dr
- 2815 Mount Harrison Dr
- 543 Clear Springs St
- 724 Lake Cleveland St