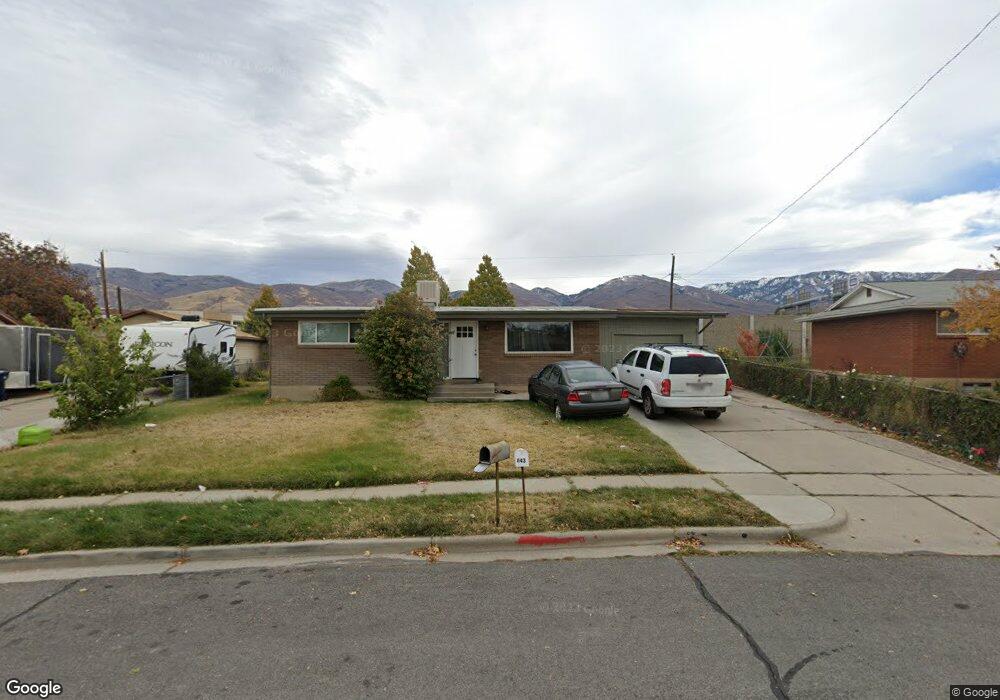
843 S 665 W Woods Cross, UT 84087
Estimated Value: $448,000 - $500,477
4
Beds
2
Baths
1,924
Sq Ft
$250/Sq Ft
Est. Value
About This Home
This home is located at 843 S 665 W, Woods Cross, UT 84087 and is currently estimated at $480,619, approximately $249 per square foot. 843 S 665 W is a home located in Davis County with nearby schools including Woods Cross Elementary School, Millcreek Junior High School, and Woods Cross High School.
Ownership History
Date
Name
Owned For
Owner Type
Purchase Details
Closed on
Feb 9, 2021
Sold by
Eden Real Properties Llc
Bought by
Ittaaehau Paula Pinau and Ittaaehau Kasanita
Current Estimated Value
Home Financials for this Owner
Home Financials are based on the most recent Mortgage that was taken out on this home.
Original Mortgage
$333,000
Outstanding Balance
$297,151
Interest Rate
2.7%
Mortgage Type
New Conventional
Estimated Equity
$183,468
Purchase Details
Closed on
Nov 3, 2006
Sold by
Brown Blanche and Rognon Shelley Lee Brown
Bought by
Brown Blanche
Home Financials for this Owner
Home Financials are based on the most recent Mortgage that was taken out on this home.
Original Mortgage
$97,500
Interest Rate
6.3%
Mortgage Type
New Conventional
Purchase Details
Closed on
Dec 2, 1999
Sold by
Brown Blanche
Bought by
Brown Blanche and Rognon Shelley Lee Brown
Create a Home Valuation Report for This Property
The Home Valuation Report is an in-depth analysis detailing your home's value as well as a comparison with similar homes in the area
Home Values in the Area
Average Home Value in this Area
Purchase History
| Date | Buyer | Sale Price | Title Company |
|---|---|---|---|
| Ittaaehau Paula Pinau | -- | First American Title | |
| Brown Blanche | -- | Eagle Pointe Title Ins | |
| Brown Blanche | -- | -- |
Source: Public Records
Mortgage History
| Date | Status | Borrower | Loan Amount |
|---|---|---|---|
| Open | Ittaaehau Paula Pinau | $333,000 | |
| Previous Owner | Brown Blanche | $97,500 |
Source: Public Records
Tax History Compared to Growth
Tax History
| Year | Tax Paid | Tax Assessment Tax Assessment Total Assessment is a certain percentage of the fair market value that is determined by local assessors to be the total taxable value of land and additions on the property. | Land | Improvement |
|---|---|---|---|---|
| 2025 | $2,793 | $242,000 | $113,369 | $128,631 |
| 2024 | $2,796 | $249,150 | $121,213 | $127,937 |
| 2023 | $2,666 | $442,000 | $160,874 | $281,126 |
| 2022 | $2,715 | $250,250 | $69,900 | $180,350 |
| 2021 | $2,435 | $357,000 | $102,699 | $254,301 |
| 2020 | $1,779 | $254,000 | $97,789 | $156,211 |
| 2019 | $1,781 | $251,000 | $91,108 | $159,892 |
| 2018 | $1,618 | $226,000 | $89,565 | $136,435 |
| 2016 | $1,322 | $101,090 | $38,596 | $62,494 |
| 2015 | $1,265 | $93,500 | $38,596 | $54,904 |
| 2014 | $1,208 | $92,022 | $38,596 | $53,426 |
| 2013 | -- | $87,009 | $21,811 | $65,198 |
Source: Public Records
Map
Nearby Homes
- 743 W 1000 S
- 758 W 1000 S
- 553 Clark St
- 990 S 500 W
- 1289 S 675 W
- 730 W 1400 S
- 680 W 500 S Unit 22
- 680 W 500 S Unit 17
- 360 W 800 S
- 1602 S 550 W
- 254 W 650 S
- 1552 S 850 W
- 167 S 425 W
- 1137 S 1050 W
- 1314 S 200 W Unit 19
- 1623 S 925 W
- 1056 W Audrey Ln Unit 14
- 770 W 1900 S
- 1064 W Audrey Ln Unit 15
- 1067 W Audrey Ln Unit 8