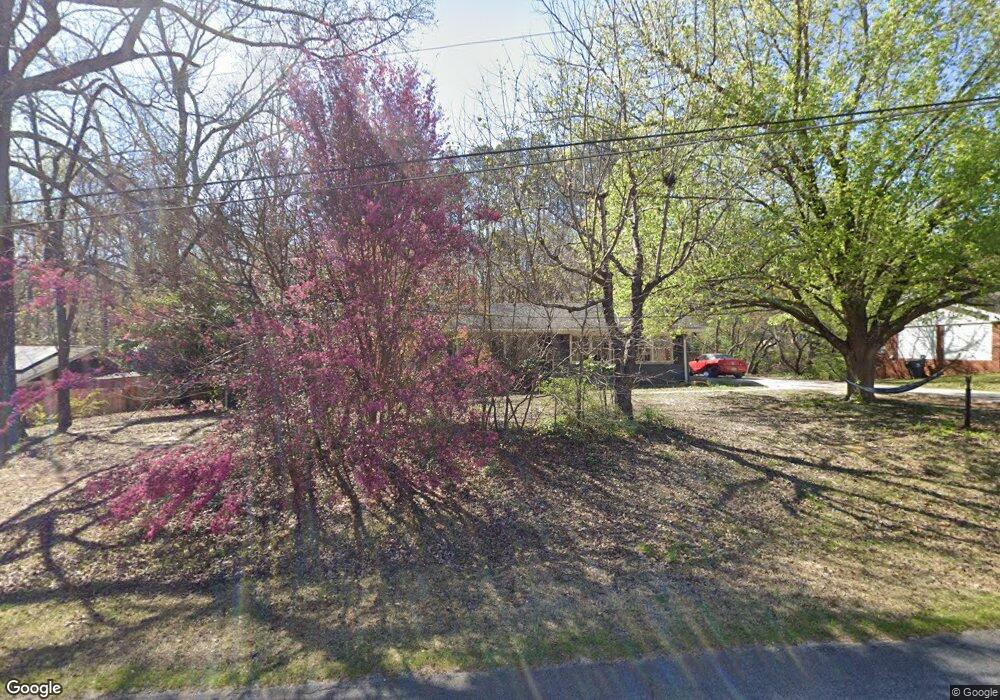
843 Sinyard Rd Lithia Springs, GA 30122
Lithia Springs NeighborhoodEstimated Value: $258,000 - $318,000
3
Beds
2
Baths
1,634
Sq Ft
$175/Sq Ft
Est. Value
About This Home
This home is located at 843 Sinyard Rd, Lithia Springs, GA 30122 and is currently estimated at $286,523, approximately $175 per square foot. 843 Sinyard Rd is a home located in Douglas County with nearby schools including Lithia Springs Elementary School, Turner Middle School, and Lithia Springs Comprehensive High School.
Ownership History
Date
Name
Owned For
Owner Type
Purchase Details
Closed on
Nov 17, 2010
Sold by
Federal Home Loan Mortgage Corporation
Bought by
Berumen Tammy D
Current Estimated Value
Home Financials for this Owner
Home Financials are based on the most recent Mortgage that was taken out on this home.
Original Mortgage
$47,664
Outstanding Balance
$31,336
Interest Rate
4.2%
Mortgage Type
FHA
Estimated Equity
$255,187
Purchase Details
Closed on
Aug 3, 2010
Sold by
Jp Morgan Chase Bk
Bought by
Federal Home Loan Mortgage Corporation
Purchase Details
Closed on
Apr 11, 1997
Sold by
Hunt R Byron R and Hunt Nancy B
Bought by
Camp Charles E and Camp Bobbie J
Create a Home Valuation Report for This Property
The Home Valuation Report is an in-depth analysis detailing your home's value as well as a comparison with similar homes in the area
Home Values in the Area
Average Home Value in this Area
Purchase History
| Date | Buyer | Sale Price | Title Company |
|---|---|---|---|
| Berumen Tammy D | -- | -- | |
| Federal Home Loan Mortgage Corporation | -- | -- | |
| Jp Morgan Chase Bk | $40,836 | -- | |
| Camp Charles E | $81,000 | -- |
Source: Public Records
Mortgage History
| Date | Status | Borrower | Loan Amount |
|---|---|---|---|
| Open | Berumen Tammy D | $47,664 | |
| Closed | Camp Charles E | -- |
Source: Public Records
Tax History Compared to Growth
Tax History
| Year | Tax Paid | Tax Assessment Tax Assessment Total Assessment is a certain percentage of the fair market value that is determined by local assessors to be the total taxable value of land and additions on the property. | Land | Improvement |
|---|---|---|---|---|
| 2024 | $1,988 | $86,520 | $27,000 | $59,520 |
| 2023 | $1,988 | $86,520 | $27,000 | $59,520 |
| 2022 | $1,606 | $64,280 | $20,000 | $44,280 |
| 2021 | $1,425 | $54,600 | $17,800 | $36,800 |
| 2020 | $1,550 | $59,640 | $16,600 | $43,040 |
| 2019 | $1,480 | $58,600 | $16,600 | $42,000 |
| 2018 | $1,299 | $49,520 | $14,440 | $35,080 |
| 2017 | $1,265 | $47,120 | $15,000 | $32,120 |
| 2016 | $1,230 | $44,760 | $14,720 | $30,040 |
| 2015 | $1,053 | $35,480 | $11,920 | $23,560 |
| 2014 | $891 | $28,212 | $9,880 | $18,332 |
| 2013 | -- | $28,900 | $10,160 | $18,740 |
Source: Public Records
Map
Nearby Homes
- 3245 W Anderson Dr
- 3403 Linda Dr
- 3340 Skyview Dr
- 3347 Skyview Dr
- 3138 Beechwood Dr
- 6069 Wisteria Ln
- 7315 Lee Rd
- 2019 Dutchess Rd
- 2081 Orchid Ln
- 6889 Kingsboro Dr Unit 2
- 545 Paces Dr
- 2102 Orchid Ln
- 480 Paces Dr
- 3476 Cooper St
- 475 Paces Dr
- 485 Paces Dr
- 515 Paces Dr
- 0 W Lake Vulcan Dr Unit 10587241
- Heron Cottage Plan at Paces Estates
- 831 Sinyard Rd
- 855 Sinyard Rd
- 844 Sinyard Rd
- 867 Sinyard Rd
- 879 Sinyard Rd
- 817 Sinyard Rd
- 832 Sinyard Rd
- 818 Sinyard Rd
- 3325 Linda Dr
- 868 Sinyard Rd
- 805 Sinyard Rd
- 810 Sinyard Rd
- 3315 Honeysuckle Ln
- 3304 Linda Dr
- 3335 Linda Dr
- 793 Sinyard Rd
- 3310 Honeysuckle Ln
- 794 Sinyard Rd
- 2310 Brenda Ln
- 2266 Brenda Ln