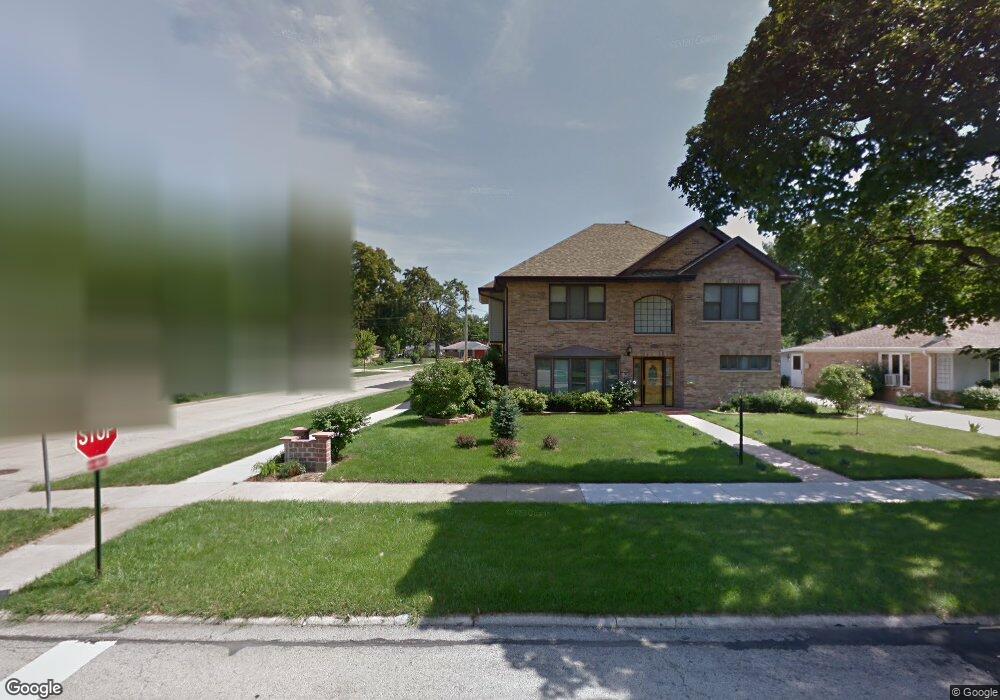
843 W Grant Dr Des Plaines, IL 60016
Estimated Value: $330,000 - $351,000
2
Beds
1
Bath
1,019
Sq Ft
$335/Sq Ft
Est. Value
About This Home
This home is located at 843 W Grant Dr, Des Plaines, IL 60016 and is currently estimated at $341,524, approximately $335 per square foot. 843 W Grant Dr is a home located in Cook County with nearby schools including Forest Elementary School, Algonquin Middle School, and Maine West High School.
Ownership History
Date
Name
Owned For
Owner Type
Purchase Details
Closed on
Jun 14, 2019
Sold by
Thvedt Joshua John and Kochan Diana A
Bought by
Salerno Charles J and Bowman Naomi J
Current Estimated Value
Home Financials for this Owner
Home Financials are based on the most recent Mortgage that was taken out on this home.
Original Mortgage
$208,000
Outstanding Balance
$181,354
Interest Rate
4.1%
Mortgage Type
New Conventional
Estimated Equity
$160,170
Purchase Details
Closed on
Jul 15, 1999
Sold by
Jung Richard J
Bought by
Thvedi Joshua John and Kochan Diana A
Home Financials for this Owner
Home Financials are based on the most recent Mortgage that was taken out on this home.
Original Mortgage
$149,150
Interest Rate
7.69%
Create a Home Valuation Report for This Property
The Home Valuation Report is an in-depth analysis detailing your home's value as well as a comparison with similar homes in the area
Home Values in the Area
Average Home Value in this Area
Purchase History
We collect this data history from publicly available records. To have your information removed, we recommend requesting removal directly through your county’s website.
| Date | Buyer | Sale Price | Title Company |
|---|---|---|---|
| Salerno Charles J | $260,000 | Attorney | |
| Thvedi Joshua John | $157,000 | -- |
Source: Public Records
Mortgage History
We collect this data history from publicly available records. To have your information removed, we recommend requesting removal directly through your county’s website.
| Date | Status | Borrower | Loan Amount |
|---|---|---|---|
| Open | Salerno Charles J | $208,000 | |
| Previous Owner | Thvedi Joshua John | $149,150 |
Source: Public Records
Tax History
| Year | Tax Paid | Tax Assessment Tax Assessment Total Assessment is a certain percentage of the fair market value that is determined by local assessors to be the total taxable value of land and additions on the property. | Land | Improvement |
|---|---|---|---|---|
| 2025 | $6,245 | $30,000 | $6,015 | $23,985 |
| 2024 | $6,245 | $27,000 | $5,012 | $21,988 |
| 2023 | $6,067 | $27,000 | $5,012 | $21,988 |
| 2022 | $6,067 | $27,000 | $5,012 | $21,988 |
| 2021 | $3,605 | $15,059 | $4,176 | $10,883 |
| 2020 | $3,613 | $15,059 | $4,176 | $10,883 |
| 2019 | $4,246 | $19,208 | $4,176 | $15,032 |
| 2018 | $4,491 | $18,451 | $3,675 | $14,776 |
| 2017 | $4,429 | $18,451 | $3,675 | $14,776 |
| 2016 | $4,854 | $19,966 | $3,675 | $16,291 |
| 2015 | $3,555 | $14,383 | $3,174 | $11,209 |
| 2014 | $4,013 | $16,130 | $3,174 | $12,956 |
| 2013 | $3,896 | $16,130 | $3,174 | $12,956 |
Source: Public Records
Map
Nearby Homes
- 942 W Villa Dr
- 940 W Grant Dr
- 980 W Grant Dr
- 870 E Thacker St
- 1076 S 3rd Ave
- 963 E Prairie Ave
- 1042 Alfini Dr
- 946 Walter Ave
- 1023 Margret St
- 1205 S Wolf Rd
- 1117 Margret St
- 1152 E Walnut Ave
- 910 Hollywood Ave
- 879 North Ave
- 191 Ashland Ave
- 890 North Ave
- 625 Arlington Ave
- 900 Lee St Unit 202
- 1458 Kingston Ct
- 505 Forest Ave
- 905 E Villa Dr
- 909 E Villa Dr
- 903 E Villa Dr
- 844 W Grant Dr
- 840 E Grant Dr
- 901 E Villa Dr
- 846 E Grant Dr
- 838 E Grant Dr
- 852 W Grant Dr
- 910 E Villa Dr
- 909 W Villa Dr
- 856 E Grant Dr
- 834 W Grant Dr
- 858 W Grant Dr
- 916 E Villa Dr
- 826 W Grant Dr
- 915 W Villa Dr
- 897 Northeast Place
- 906 W Villa Dr
- 926 E Villa Dr
Your Personal Tour Guide
Ask me questions while you tour the home.