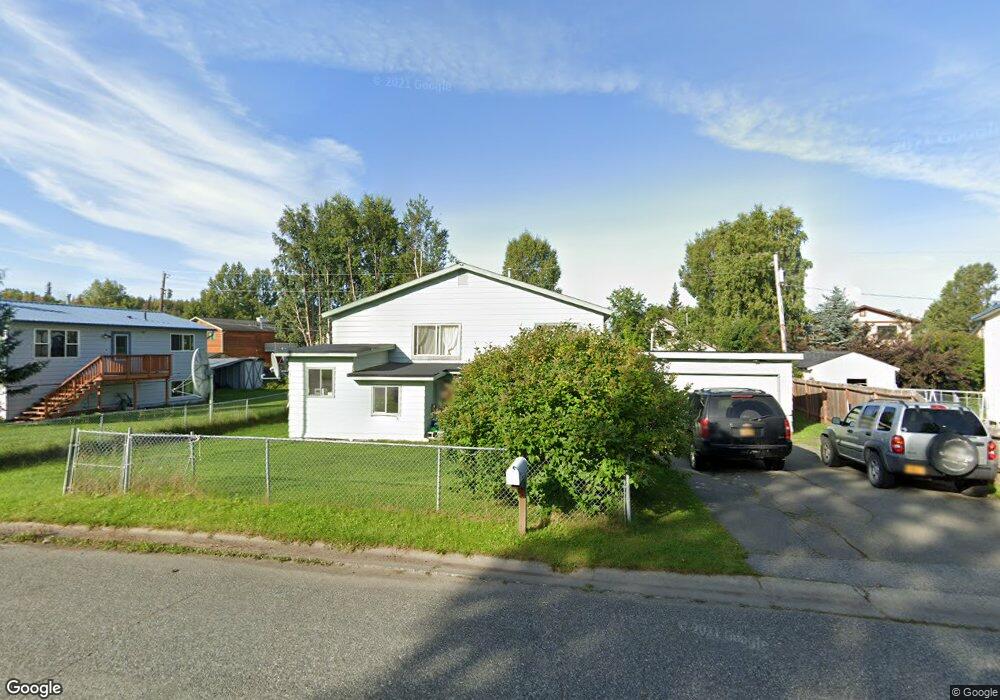
8430 Craiger Ct Anchorage, AK 99507
Abbott Loop NeighborhoodEstimated Value: $366,000 - $586,000
4
Beds
3
Baths
1,923
Sq Ft
$243/Sq Ft
Est. Value
About This Home
This home is located at 8430 Craiger Ct, Anchorage, AK 99507 and is currently estimated at $467,768, approximately $243 per square foot. 8430 Craiger Ct is a home located in Anchorage Municipality with nearby schools including Trailside Elementary, Hanshew Middle School, and Service High School.
Ownership History
Date
Name
Owned For
Owner Type
Purchase Details
Closed on
Nov 2, 2006
Sold by
Cannata Michael A and Cannata Karla K
Bought by
Johnson Maynard C and Johnson Regina
Current Estimated Value
Home Financials for this Owner
Home Financials are based on the most recent Mortgage that was taken out on this home.
Original Mortgage
$250,900
Outstanding Balance
$148,114
Interest Rate
6.36%
Mortgage Type
Purchase Money Mortgage
Estimated Equity
$319,654
Purchase Details
Closed on
Feb 9, 2004
Sold by
Richardson James E and Richardson April Renee
Bought by
Cannata Michael A and Cannata Karla K
Home Financials for this Owner
Home Financials are based on the most recent Mortgage that was taken out on this home.
Original Mortgage
$158,672
Interest Rate
5.8%
Mortgage Type
Purchase Money Mortgage
Purchase Details
Closed on
Apr 27, 2001
Sold by
Hadley Patrick B and Hadley Gayle M
Bought by
Richardson James E and Richardson April Renee
Home Financials for this Owner
Home Financials are based on the most recent Mortgage that was taken out on this home.
Original Mortgage
$152,490
Interest Rate
6.98%
Mortgage Type
Purchase Money Mortgage
Purchase Details
Closed on
Apr 25, 2001
Sold by
Hadley Patrick B and Hadley Gayle M
Bought by
Richardson James E and Richardson April Renee
Home Financials for this Owner
Home Financials are based on the most recent Mortgage that was taken out on this home.
Original Mortgage
$152,490
Interest Rate
6.98%
Mortgage Type
Purchase Money Mortgage
Create a Home Valuation Report for This Property
The Home Valuation Report is an in-depth analysis detailing your home's value as well as a comparison with similar homes in the area
Home Values in the Area
Average Home Value in this Area
Purchase History
| Date | Buyer | Sale Price | Title Company |
|---|---|---|---|
| Johnson Maynard C | -- | None Available | |
| Cannata Michael A | -- | -- | |
| Richardson James E | -- | -- | |
| Richardson James E | -- | -- | |
| Richardson James E | -- | -- |
Source: Public Records
Mortgage History
| Date | Status | Borrower | Loan Amount |
|---|---|---|---|
| Open | Johnson Maynard C | $250,900 | |
| Previous Owner | Cannata Michael A | $158,672 | |
| Previous Owner | Richardson James E | $152,490 | |
| Previous Owner | Richardson James E | $152,490 |
Source: Public Records
Tax History Compared to Growth
Tax History
| Year | Tax Paid | Tax Assessment Tax Assessment Total Assessment is a certain percentage of the fair market value that is determined by local assessors to be the total taxable value of land and additions on the property. | Land | Improvement |
|---|---|---|---|---|
| 2025 | $4,982 | $380,800 | $97,400 | $283,400 |
| 2024 | $4,982 | $383,600 | $97,400 | $286,200 |
| 2023 | $5,961 | $350,000 | $97,400 | $252,600 |
| 2022 | $4,917 | $342,000 | $97,400 | $244,600 |
| 2021 | $5,529 | $306,800 | $97,400 | $209,400 |
| 2020 | $4,267 | $301,300 | $97,400 | $203,900 |
| 2019 | $4,119 | $301,800 | $97,400 | $204,400 |
| 2018 | $4,110 | $300,600 | $97,400 | $203,200 |
| 2017 | $4,490 | $306,700 | $93,200 | $213,500 |
| 2016 | $3,894 | $304,600 | $93,200 | $211,400 |
| 2015 | $3,894 | $301,400 | $93,200 | $208,200 |
| 2014 | $3,894 | $283,000 | $78,900 | $204,100 |
Source: Public Records
Map
Nearby Homes
- 4041 Truro Dr
- 4011 Iona Cir
- 4000 Justin Cir
- 3930 Eric Cir
- 8203 Parkridge Cir
- 3831 Winchester Loop
- 8662 Spruce Brook St
- 7811 Kiana Cir
- 9191 Chapelle Cir
- 8131 Medellin Cir
- 8944 Little Brook St
- 8530 Gordon Cir
- 8933 Sahalee Dr
- 3220 Travis Ln
- 7511 Randamar Place
- Lt 87 Carlson Rd
- L82 Carlson Rd
- 9203 Strutz Ave
- 7250 Cantonment Ct
- 2812 Bass St
- 8420 Craiger Ct
- 8450 Craiger Ct
- 8421 Fox Lair Cir
- 8431 Fox Lair Cir
- 8411 Fox Lair Cir
- 8441 Fox Lair Cir
- 8431 Foxlair Cir
- 8500 Craiger Ct
- 4000 E 84th Ave
- 8451 Fox Lair Cir
- 8401 Fox Lair Cir
- 8401 Craiger Ct
- 8451 Foxlair Cir
- 8431 Craiger Ct
- 8441 Craiger Ct
- 8510 Craiger Ct
- 8461 Fox Lair Cir
- 8501 Craiger Ct
- 8501 Craiger Ct Unit 8501
- 4034 E 84th Ave