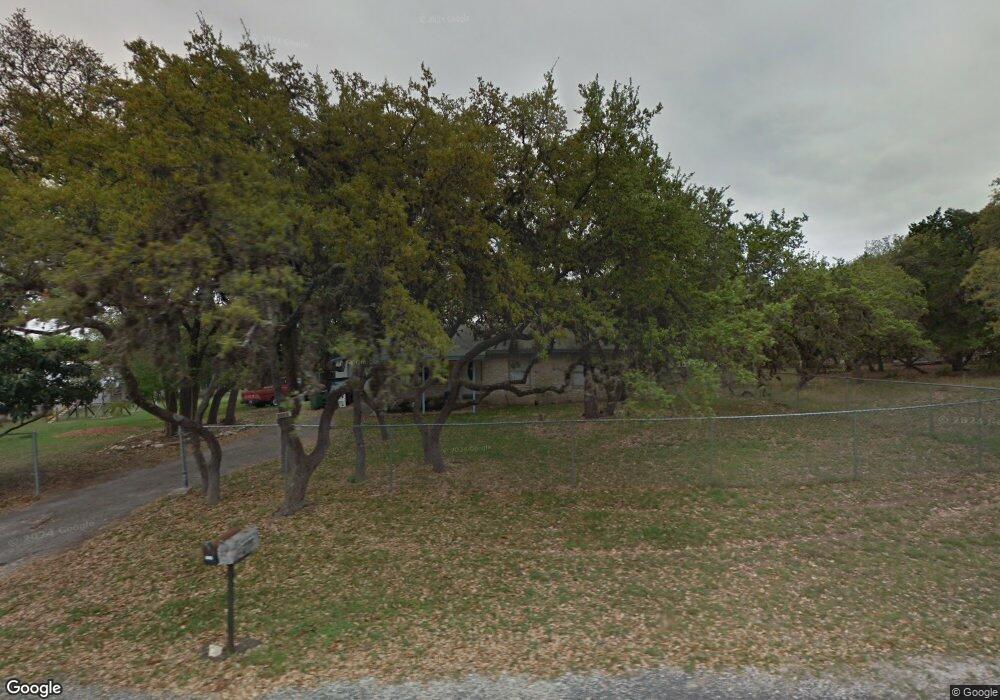
8430 Flint Rock Dr Boerne, TX 78006
Scenic Oaks NeighborhoodEstimated Value: $431,224 - $436,000
3
Beds
2
Baths
1,668
Sq Ft
$260/Sq Ft
Est. Value
About This Home
This home is located at 8430 Flint Rock Dr, Boerne, TX 78006 and is currently estimated at $433,306, approximately $259 per square foot. 8430 Flint Rock Dr is a home located in Bexar County with nearby schools including Aue Elementary School, Rawlinson Middle School, and Clark High School.
Ownership History
Date
Name
Owned For
Owner Type
Purchase Details
Closed on
Jun 11, 2019
Sold by
Perry Homes Llc
Bought by
Martinez Alberto and Martinez Dolores
Current Estimated Value
Home Financials for this Owner
Home Financials are based on the most recent Mortgage that was taken out on this home.
Original Mortgage
$303,001
Outstanding Balance
$266,412
Interest Rate
4.1%
Mortgage Type
VA
Estimated Equity
$166,894
Purchase Details
Closed on
May 26, 2010
Sold by
Arkangel Helffrich Judith and Helfrich Jerome
Bought by
Woodworth Hilary Yvonne and Woodworth Norman Joseph
Home Financials for this Owner
Home Financials are based on the most recent Mortgage that was taken out on this home.
Original Mortgage
$163,400
Interest Rate
5%
Mortgage Type
New Conventional
Purchase Details
Closed on
Jan 25, 2001
Sold by
Wilhousky Steven and Wilhousky Steven Emil
Bought by
Arkangel Judith and Arkangel Wilhousky Judith
Create a Home Valuation Report for This Property
The Home Valuation Report is an in-depth analysis detailing your home's value as well as a comparison with similar homes in the area
Home Values in the Area
Average Home Value in this Area
Purchase History
| Date | Buyer | Sale Price | Title Company |
|---|---|---|---|
| Martinez Alberto | -- | Chicago Title | |
| Woodworth Hilary Yvonne | -- | Ttt | |
| Arkangel Judith | -- | -- |
Source: Public Records
Mortgage History
| Date | Status | Borrower | Loan Amount |
|---|---|---|---|
| Open | Martinez Alberto | $303,001 | |
| Previous Owner | Woodworth Hilary Yvonne | $163,400 |
Source: Public Records
Tax History Compared to Growth
Tax History
| Year | Tax Paid | Tax Assessment Tax Assessment Total Assessment is a certain percentage of the fair market value that is determined by local assessors to be the total taxable value of land and additions on the property. | Land | Improvement |
|---|---|---|---|---|
| 2025 | $5,826 | $437,700 | $129,200 | $308,500 |
| 2024 | $5,826 | $406,860 | $129,200 | $318,900 |
| 2023 | $5,826 | $369,873 | $129,200 | $289,230 |
| 2022 | $6,676 | $336,248 | $107,670 | $268,350 |
| 2021 | $6,297 | $305,680 | $85,230 | $220,450 |
| 2020 | $6,246 | $296,760 | $84,780 | $211,980 |
| 2019 | $6,292 | $289,050 | $77,070 | $211,980 |
| 2018 | $6,109 | $280,580 | $77,070 | $203,510 |
| 2017 | $5,836 | $267,227 | $86,790 | $200,170 |
| 2016 | $5,306 | $242,934 | $86,790 | $168,490 |
| 2015 | -- | $220,849 | $59,520 | $183,730 |
| 2014 | -- | $200,772 | $0 | $0 |
Source: Public Records
Map
Nearby Homes
- 8612 Flint Rock Dr
- 26308 Reyglen Dr
- 26018 Hazy Hollow
- 8618 Indian Hills Ln
- 8615 Traciney Blvd
- 26042 Cypress Oaks
- 26815 Tulip Meadow
- 8707 Paisano Pass
- 8715 Buckskin Dr
- 26910 Oleander Chase
- 26214 Tawny Way
- 26919 Camellia Trace
- 26651 Callaway Run
- 25802 Hazy Hollow
- 8718 Paisano Pass
- 8211 Snowdeal Ln
- 27013 Camellia Trace
- 26111 Costa Brava
- 8735 Paseo Oaks
- 25764 Velvet Creek
- 26311 Susan Cir
- 26320 Jason Ave
- 8440 Flint Rock Dr
- 26308 Susan Cir
- 8407 Flint Rock Dr
- 8343 Flint Rock Dr
- 8411 Flint Rock Dr
- 8718 Flint Rock Dr
- 8722 Flint Rock Dr
- 26323 Jason Ave
- 26307 Susan Cir
- 26316 Jason Ave
- 26304 Susan Cir
- 8410 Flint Rock Dr
- 8307 Traciney Blvd
- 8455 Flint Rock Dr
- 26319 Jason Ave
- 8470 Flint Rock Dr
- 8424 Indian Hills Ln
- 26303 Susan Cir