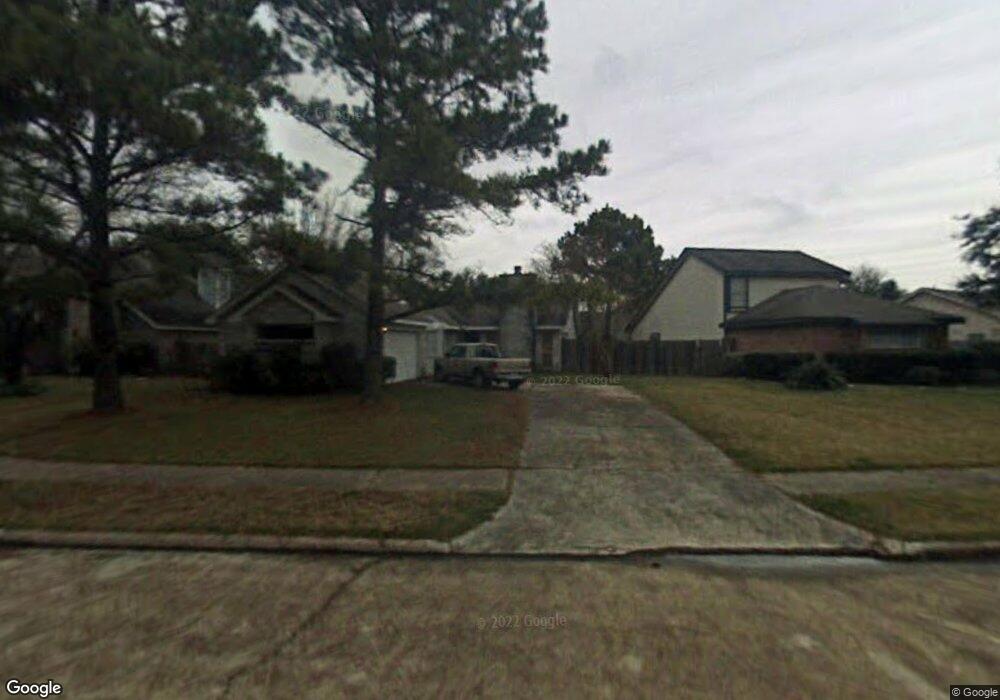
8431 Greenleaf Lake Dr Houston, TX 77095
Copperfield NeighborhoodEstimated Value: $228,048 - $254,000
3
Beds
2
Baths
1,380
Sq Ft
$175/Sq Ft
Est. Value
About This Home
This home is located at 8431 Greenleaf Lake Dr, Houston, TX 77095 and is currently estimated at $242,012, approximately $175 per square foot. 8431 Greenleaf Lake Dr is a home located in Harris County with nearby schools including Fiest Elementary School, Labay Middle School, and Cypress Falls High School.
Ownership History
Date
Name
Owned For
Owner Type
Purchase Details
Closed on
Feb 19, 2004
Sold by
Vela Lonnie and Vela Lisa Elaine
Bought by
Alland Lesley
Current Estimated Value
Home Financials for this Owner
Home Financials are based on the most recent Mortgage that was taken out on this home.
Original Mortgage
$86,300
Outstanding Balance
$41,288
Interest Rate
6.12%
Mortgage Type
Stand Alone First
Estimated Equity
$200,724
Purchase Details
Closed on
Nov 27, 2001
Sold by
Sergio Cynthia and Sergio Ken
Bought by
Vela Lonnie
Home Financials for this Owner
Home Financials are based on the most recent Mortgage that was taken out on this home.
Original Mortgage
$89,195
Interest Rate
6.57%
Mortgage Type
FHA
Create a Home Valuation Report for This Property
The Home Valuation Report is an in-depth analysis detailing your home's value as well as a comparison with similar homes in the area
Home Values in the Area
Average Home Value in this Area
Purchase History
| Date | Buyer | Sale Price | Title Company |
|---|---|---|---|
| Alland Lesley | -- | Stewart Title Houston Div | |
| Vela Lonnie | -- | Startex Title Company |
Source: Public Records
Mortgage History
| Date | Status | Borrower | Loan Amount |
|---|---|---|---|
| Open | Alland Lesley | $86,300 | |
| Previous Owner | Vela Lonnie | $89,195 | |
| Closed | Alland Lesley | $21,600 |
Source: Public Records
Tax History Compared to Growth
Tax History
| Year | Tax Paid | Tax Assessment Tax Assessment Total Assessment is a certain percentage of the fair market value that is determined by local assessors to be the total taxable value of land and additions on the property. | Land | Improvement |
|---|---|---|---|---|
| 2025 | $2,453 | $224,274 | $70,176 | $154,098 |
| 2024 | $2,453 | $209,685 | $61,022 | $148,663 |
| 2023 | $2,453 | $219,601 | $61,022 | $158,579 |
| 2022 | $3,949 | $197,405 | $48,817 | $148,588 |
| 2021 | $3,782 | $162,909 | $48,817 | $114,092 |
| 2020 | $3,629 | $152,164 | $40,681 | $111,483 |
| 2019 | $3,667 | $148,564 | $33,901 | $114,663 |
| 2018 | $1,203 | $135,646 | $33,901 | $101,745 |
| 2017 | $3,000 | $130,794 | $33,901 | $96,893 |
| 2016 | $3,000 | $130,794 | $33,901 | $96,893 |
| 2015 | $1,994 | $126,367 | $33,901 | $92,466 |
| 2014 | $1,994 | $114,996 | $26,443 | $88,553 |
Source: Public Records
Map
Nearby Homes
- 8306 Lake Crystal Dr
- 8526 Hot Springs Dr
- 15954 Oak Mountain Dr
- 8550 Sparkling Springs Dr
- 8526 Greenleaf Lake Dr
- 15918 Pinyon Creek Dr
- 8203 Green Devon Dr
- 8426 Laurel Trails Dr
- 15735 Jamie Lee Dr
- 15611 Meadow Village Dr
- 8818 Apple Mill Dr
- 8550 Waiting Spring Ln
- 15634 Haleys Landing Ln
- 16111 Aberdeen Forest Dr
- 16123 Aberdeen Forest Dr
- 8814 Sherina Park Dr
- 15610 Tarpon Springs Ct
- 15802 Aberdeen Trails Dr
- 8211 Riverglade Dr
- 15610 Manorford Ct
- 8427 Greenleaf Lake Dr
- 8435 Greenleaf Lake Dr
- 15815 Locust Grove Dr
- 8423 Greenleaf Lake Dr
- 8439 Greenleaf Lake Dr
- 15819 Locust Grove Dr
- 8407 Emerald Valley Ct
- 8426 Greenleaf Lake Dr
- 15811 Locust Grove Dr
- 8419 Greenleaf Lake Dr
- 8443 Greenleaf Lake Dr
- 15814 Locust Grove Dr
- 8403 Emerald Valley Ct
- 8410 Emerald Valley Ct
- 8418 Greenleaf Lake Dr
- 15807 Locust Grove Dr
- 8447 Greenleaf Lake Dr
- 8406 Emerald Valley Ct
- 8402 Emerald Valley Ct
- 8414 Greenleaf Lake Dr