Estimated Value: $409,000 - $459,000
3
Beds
1
Bath
1,100
Sq Ft
$397/Sq Ft
Est. Value
About This Home
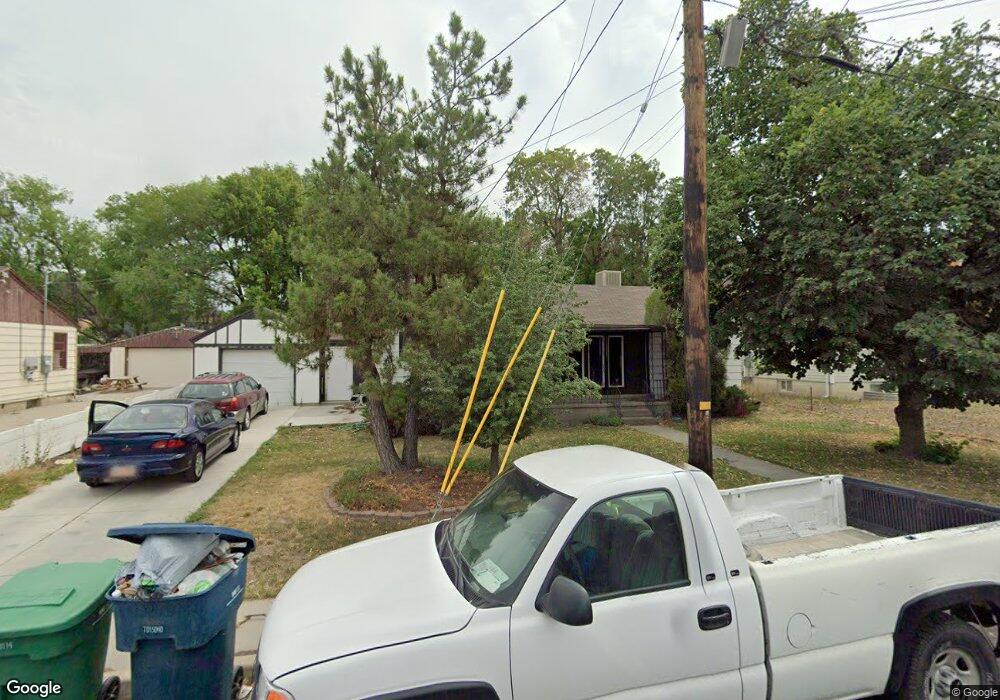
This home is located at 8431 S 115 E, Sandy, UT 84070 and is currently estimated at $436,520, approximately $396 per square foot. 8431 S 115 E is a home located in Salt Lake County with nearby schools including Sandy Elementary School, Mount Jordan Middle School, and Jordan High.
Ownership History
Date
Name
Owned For
Owner Type
Purchase Details
Closed on
Aug 15, 2025
Sold by
Montague Kristin
Bought by
Km West Llc Series 8431
Current Estimated Value
Purchase Details
Closed on
Dec 8, 1998
Sold by
Lowry Patricia L
Bought by
Montague Kristin
Home Financials for this Owner
Home Financials are based on the most recent Mortgage that was taken out on this home.
Original Mortgage
$104,339
Interest Rate
6.78%
Mortgage Type
FHA
Create a Home Valuation Report for This Property
The Home Valuation Report is an in-depth analysis detailing your home's value as well as a comparison with similar homes in the area
Home Values in the Area
Average Home Value in this Area
Purchase History
| Date | Buyer | Sale Price | Title Company |
|---|---|---|---|
| Km West Llc Series 8431 | -- | None Listed On Document | |
| Montague Kristin | -- | Associated Title |
Source: Public Records
Mortgage History
| Date | Status | Borrower | Loan Amount |
|---|---|---|---|
| Previous Owner | Montague Kristin | $104,339 |
Source: Public Records
Tax History
| Year | Tax Paid | Tax Assessment Tax Assessment Total Assessment is a certain percentage of the fair market value that is determined by local assessors to be the total taxable value of land and additions on the property. | Land | Improvement |
|---|---|---|---|---|
| 2025 | $1,529 | $298,400 | $196,000 | $102,400 |
| 2024 | $1,529 | $282,700 | $183,300 | $99,400 |
| 2023 | $1,433 | $264,300 | $174,200 | $90,100 |
| 2022 | $1,515 | $273,000 | $170,800 | $102,200 |
| 2021 | $1,420 | $217,700 | $146,000 | $71,700 |
| 2020 | $1,406 | $203,300 | $138,700 | $64,600 |
| 2019 | $1,400 | $197,300 | $130,900 | $66,400 |
| 2016 | $1,202 | $162,800 | $130,900 | $31,900 |
Source: Public Records
Map
Nearby Homes
- 8470 Solar Way
- 149 E Pioneer Ave
- 227 E St Germain Way
- 139 E Abbeville Ct
- 194 Pioneer Ave
- 132 E Chambord Ct
- 220 E Pioneer Ave
- 136 E Chambord Ct
- 138 E Chambord Ct
- 140 E Chambord Ct
- 144 E Chambord Ct
- 8264 S Resaca Dr Unit K9
- 117 E Calbourne Ln Unit I4
- 90 E Resaca Dr Unit C11
- 8459 S 300 E
- 8229 S Resaca Dr Unit D3
- 116 E Resaca Dr Unit F2
- 359 E 8400 S
- 59 W Princeton Dr
- 76 Marquette Dr
- 8441 S 115 E
- 8421 S 115 E
- 8451 S 115 E
- 8430 S 115 E
- 8440 S 115 E
- 8420 S 115 E
- 8461 S 115 E
- 8397 S 115 E Unit 23
- 141 E Rochefort Ct Unit 24
- 8452 S 115 E
- 147 E Rochefort Ct
- 147 E Rochefort Ct Unit 25
- 8393 S 115 E Unit 22
- 153 E Rochefort Ct
- 153 E Rochefort Ct Unit 26
- 8473 S 115 E
- 8389 S 115 E
- 8464 S 115 E
- 8475 S 115 E
- 140 E Lavalle Ct
Your Personal Tour Guide
Ask me questions while you tour the home.