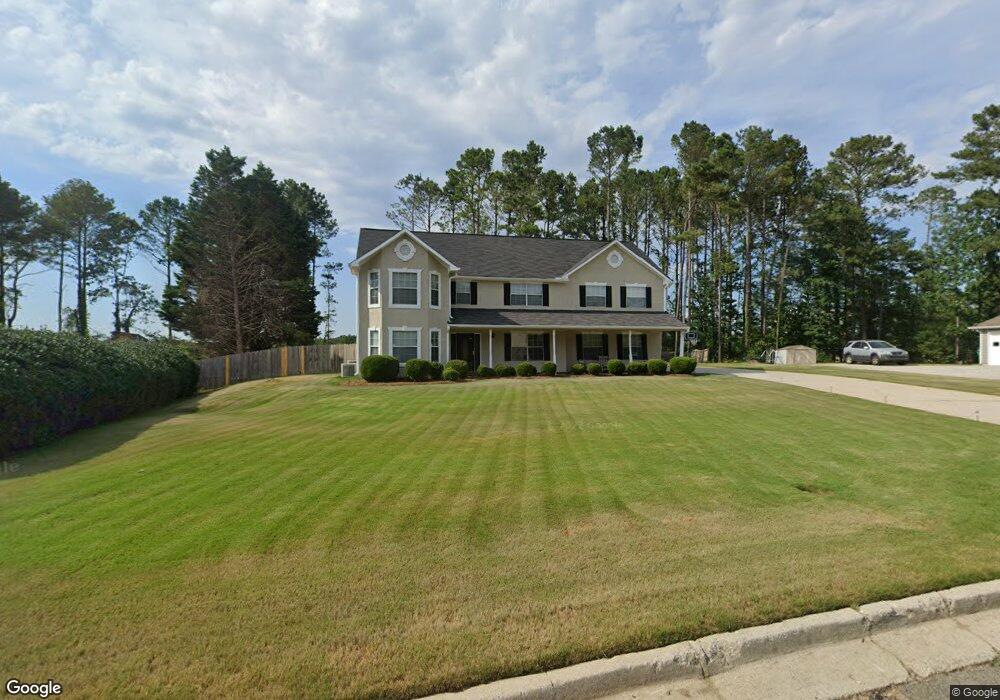
8432 Falling Rocks Way Unit 3 Lithonia, GA 30058
Estimated Value: $369,000 - $388,390
3
Beds
3
Baths
3,276
Sq Ft
$115/Sq Ft
Est. Value
About This Home
This home is located at 8432 Falling Rocks Way Unit 3, Lithonia, GA 30058 and is currently estimated at $377,848, approximately $115 per square foot. 8432 Falling Rocks Way Unit 3 is a home located in DeKalb County with nearby schools including Rock Chapel Elementary School, Lithonia Middle School, and Lithonia High School.
Ownership History
Date
Name
Owned For
Owner Type
Purchase Details
Closed on
Aug 21, 2000
Sold by
Atkinson James
Bought by
Atkinson James and Atkinson Connie
Current Estimated Value
Home Financials for this Owner
Home Financials are based on the most recent Mortgage that was taken out on this home.
Original Mortgage
$197,780
Interest Rate
7.77%
Mortgage Type
New Conventional
Purchase Details
Closed on
Feb 21, 2000
Sold by
Weldon Herbert H and Weldon Joan C
Bought by
Atkinson James
Home Financials for this Owner
Home Financials are based on the most recent Mortgage that was taken out on this home.
Original Mortgage
$159,705
Interest Rate
7.89%
Mortgage Type
New Conventional
Purchase Details
Closed on
Nov 30, 1994
Sold by
Herman Homes Inc
Bought by
Weldon Herbert H Joan
Home Financials for this Owner
Home Financials are based on the most recent Mortgage that was taken out on this home.
Original Mortgage
$144,700
Interest Rate
7.25%
Create a Home Valuation Report for This Property
The Home Valuation Report is an in-depth analysis detailing your home's value as well as a comparison with similar homes in the area
Home Values in the Area
Average Home Value in this Area
Purchase History
| Date | Buyer | Sale Price | Title Company |
|---|---|---|---|
| Atkinson James | -- | -- | |
| Atkinson James | $177,500 | -- | |
| Weldon Herbert H Joan | $152,400 | -- |
Source: Public Records
Mortgage History
| Date | Status | Borrower | Loan Amount |
|---|---|---|---|
| Closed | Atkinson James | $197,780 | |
| Previous Owner | Atkinson James | $159,705 | |
| Previous Owner | Weldon Herbert H Joan | $144,700 |
Source: Public Records
Tax History Compared to Growth
Tax History
| Year | Tax Paid | Tax Assessment Tax Assessment Total Assessment is a certain percentage of the fair market value that is determined by local assessors to be the total taxable value of land and additions on the property. | Land | Improvement |
|---|---|---|---|---|
| 2025 | $3,955 | $137,800 | $13,040 | $124,760 |
| 2024 | $4,162 | $141,920 | $13,040 | $128,880 |
| 2023 | $4,162 | $137,520 | $13,040 | $124,480 |
| 2022 | $3,682 | $123,200 | $13,040 | $110,160 |
| 2021 | $3,090 | $97,520 | $13,040 | $84,480 |
| 2020 | $2,435 | $71,680 | $13,040 | $58,640 |
| 2019 | $2,419 | $71,960 | $13,040 | $58,920 |
| 2018 | $1,887 | $66,320 | $13,040 | $53,280 |
| 2017 | $2,202 | $63,400 | $13,040 | $50,360 |
| 2016 | $1,609 | $47,760 | $13,040 | $34,720 |
| 2014 | $977 | $29,400 | $13,040 | $16,360 |
Source: Public Records
Map
Nearby Homes
- 8581 Secretariat Dr
- 8585 Secretariat Dr
- 8568 Secretariat Dr
- 1627 Palladian Way
- 1629 Palladian Way
- 8591 Secretariat Dr
- 8566 Secretariat Dr
- 1625 Palladian Way
- 8592 Secretariat Dr
- 8599 Secretariat Dr
- 8601 Secretariat Dr
- 8584 Seabiscuit Rd
- Hayden Plan at Champion's Run
- Penwell Plan at Champion's Run
- Macon Plan at Champion's Run
- Cali Plan at Champion's Run
- Galen Plan at Champion's Run
- Kerry Plan at Champion's Run
- 8564 Secretariat Dr
- 1736 Mossy Rock Cove
- 8422 Falling Rocks Way Unit 1
- 8442 Falling Rocks Way Unit 3
- 1707 Limestone Terrace
- 8412 Falling Rocks Way
- 8412 Falling Rocks Way Unit 1
- 8445 Falling Rocks Way
- 8425 Falling Rocks Way
- 1701 Limestone Terrace Unit 3
- 8600 Secretariat Dr Unit 126
- 0 Limestone Terrace Unit 7185359
- 0 Limestone Terrace Unit 7343499
- 0 Limestone Terrace Unit 7328746
- 0 Limestone Terrace
- 1720 Boulder Cove Unit 1
- 8602 Secretariat Dr Unit 127
- 8593 Secretariat Dr Unit 20
- 1714 Limestone Terrace
- 8404 Falling Rocks Way
- 8459 Falling Rocks Way
- 8590 Secretariat Dr Unit 121